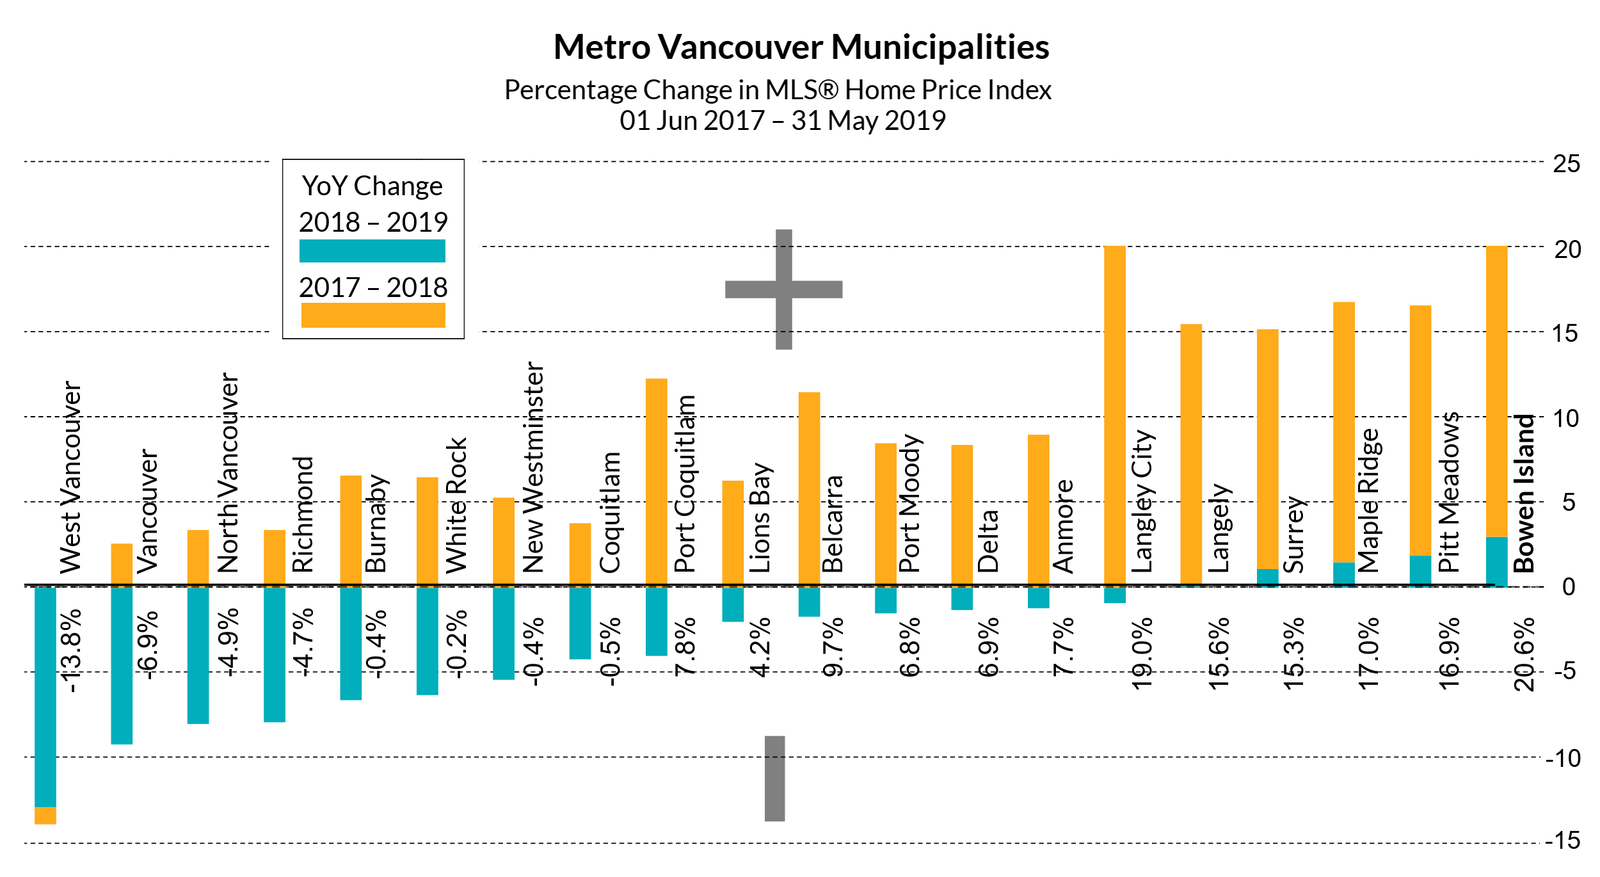
BC government policies designed to bring down house prices have been a boon to buyers in the luxury market for detached homes, where prices are significantly down. West Vancouver, Vancouver, Richmond, and North Vancouver are the only municipalities where the year-over-year MLS®Home Price Index down compared to the same period for 2017–2018.
Combined with the national ‘stress test’ regulations, these policies have not made owning a detached home in non-luxury markets more affordable and in some markets it is less affordable, especially for first-time buyers: The 2019 YoY
MLS®HPI was up in only five Metro municipalities, traditionally five of the eight most ‘affordable’ markets–Maple Ridge, Pitt Meadows, Bowen Island, Langley, and Surrey.
Although YoY Bowen Island saw the highest MLS®HPI increase (a modest 3.0 per cent) number of sales was down
-44.3 per cent, inventory was higher, days on market was up, and year-todate dollar volume of sales down -77.2 per cent. All indicators were down from YoY statistics reported in April.
Although YoY Bowen Island saw the highest MLS®HPI increase (a modest 3.0 per cent) number of sales was down
-44.3 per cent, inventory was higher, days on market was up, and year-todate dollar volume of sales down -77.2 per cent. All indicators were down from YoY statistics reported in April.
BOWEN ISLAND YOY STATS
@ 31 May 2019:
• MLS®HPI: $98 8,992
• Median Price: $859,0 00
• Average Price: $954,692
@ 30 April 2019
• MLS®HPI: $995,992
• Median Price: $870,000
• Average Price: $1,012,266
@ 31 May 2019:
• MLS®HPI: $98 8,992
• Median Price: $859,0 00
• Average Price: $954,692
@ 30 April 2019
• MLS®HPI: $995,992
• Median Price: $870,000
• Average Price: $1,012,266
STATS ON BOWEN is a detailed analysis published monthly once all data for the month has been reported.
For example, the January report would be published during the last week of February.
If you would like early access to the report during the first week of the month,