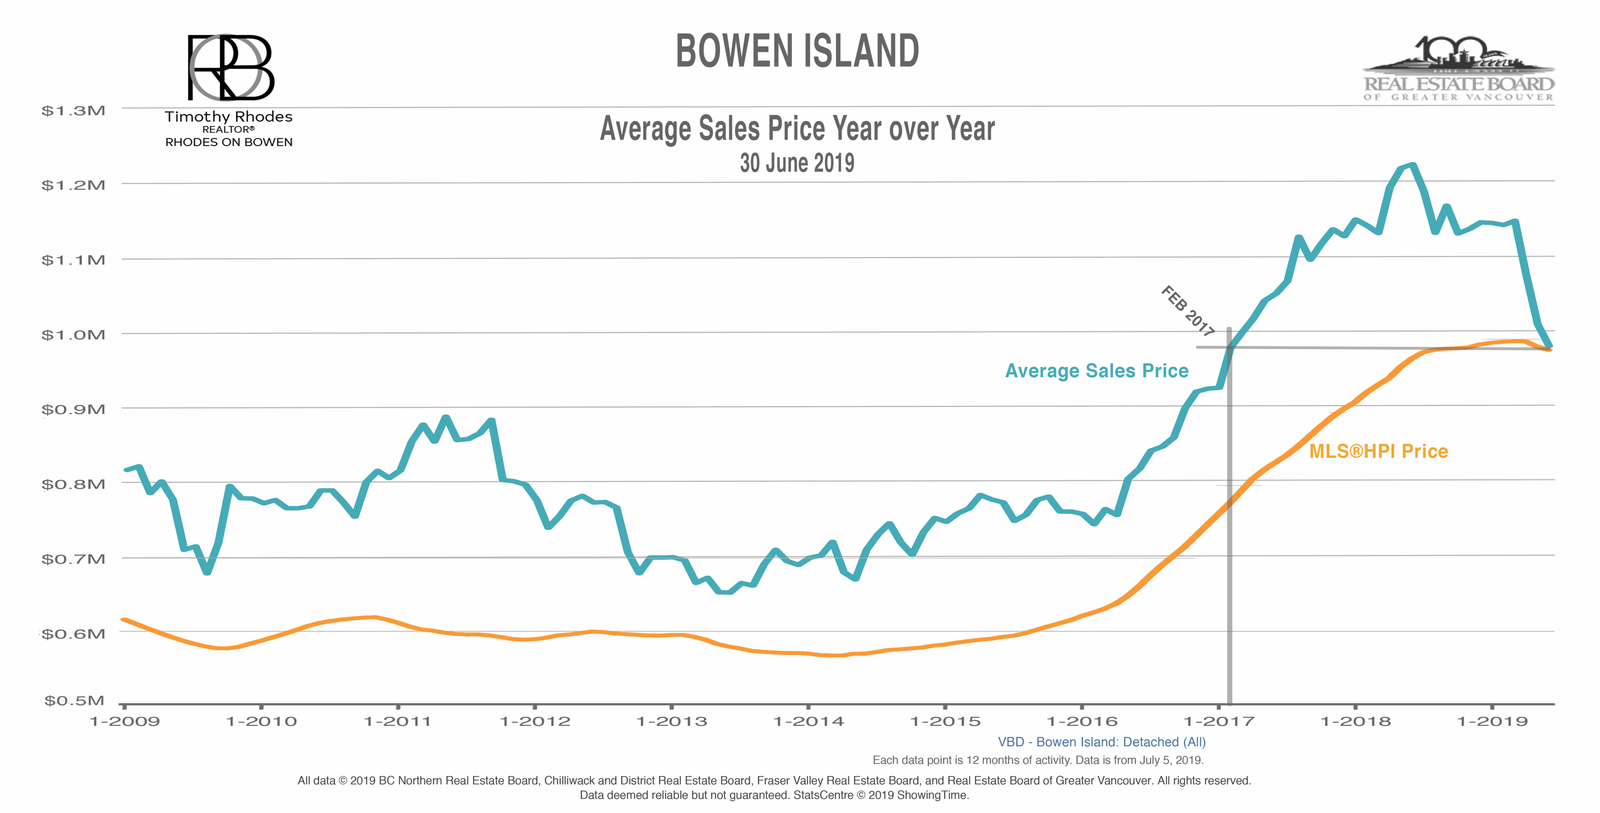
At the end of June, using year-over-year (YoY) numbers, the Average Price per Square Foot and Closed Sale Price was down to February 2017 levels, Average Percentage of Closed Sales down to 2016 levels, Dollar Volume of Sales down to 2014 levels, and Number of Sales down to 2012 levels. The YoY MLS®Home Price Index was slightly higher than the Average Sales Price ($984,267 and $980,961 respectively) which hasn’t happened in the last 20 years.
If there is good news, it is the Bowen Island market compared to our Metro Vancouver neighbours. Our -5.5 per cent YoY decline in the MLS®HPI from 2018 was less than other municipalities except for Surrey (-4.7) and Pitt Meadows (-5.5) and well below West Vancouver, Vancouver, Richmond, and Langley City, which each declined more than -12 per cent.
Sellers continue to be reluctant to move on their asking price and buyers continue to sit back and wait. If you want or need to sell and purchased prior to 2017, you will likely still have equity in your homes; however, all indicators are that there will continue to be downward pressure and pricing will be important. Year-to-date fifteen homes were sold on Bowen. Four closed on average -4.2 per cent below BC Assessment and eight closed an average 5.7 per cent above assessment. Two outliers averaged 23.2 per cent above assessment, and one newly built home closed at almost double the previous home’s assessment.
A sharp pencil pricing is called for if you are going to interest buyers.
BOWEN ISLAND YOY STATS @30 June 2019
MLS®HPI: $98 4,267
Median Price: $869,0 00
Average Price: $980,961 @31 May 2019
MLS®HPI: $995,992
Median Price: $859,000
Average Price: $954,692
MLS®HPI: $98 4,267
Median Price: $869,0 00
Average Price: $980,961 @31 May 2019
MLS®HPI: $995,992
Median Price: $859,000
Average Price: $954,692
STATS ON BOWEN is a detailed analysis published monthly once all data for the month has been reported.
For example, the January report would be published during the last week of February.
If you would like early access to the report during the first week of the month,