Activity continues to improve, but values remain restrained
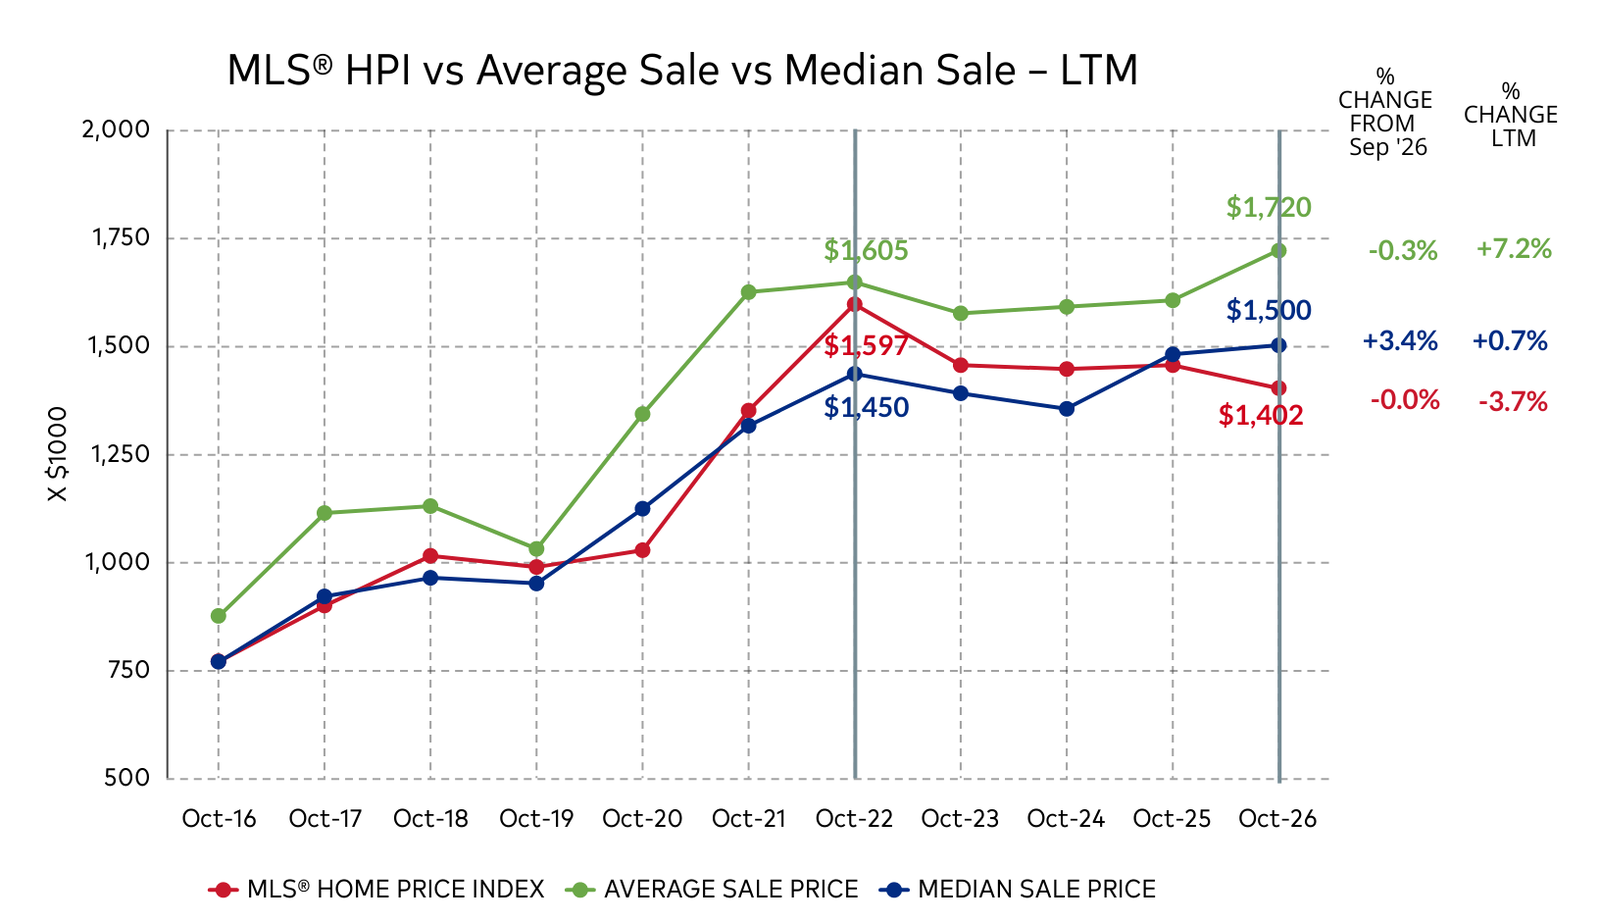
October’s numbers continue to show a Bowen Island market with improving sales activity, but with underlying benchmark values still below where they were a year ago.
On a last-twelve-month basis, there were 66 detached-home sales, up from 59 a year earlier and 49 in 2024. Dollar volume also increased substantially, reaching $114.3 million, compared with $94.3 million last year and $75.5 million two years ago. The average sale price rose to $1.732 million, while the median increased modestly to $1.495 million.
Year-to-date activity is also ahead of recent years. Through October there were 59 sales, compared with 52 in 2025 and 40 in 2024, while dollar volume reached approximately $103.9 million. New listings have also increased, however, with 158 properties coming to market year-to-date compared with 151 last year.
The Home Price Index tells a more restrained story. Bowen’s benchmark price was 3.7 percent lower than a year ago, although this represents a slight improvement from the 4.0 percent annual decline reported in September. The benchmark remained at approximately $1.402 million, unchanged from September. Bowen nevertheless continued to outperform most Metro Vancouver municipalities in terms of price stability, with only Lions Bay and Squamish recording stronger year-over-year HPI results among the markets shown.
The contrast between stronger sales statistics and a declining benchmark remains important. Over the last twelve months the average sale price increased 7.2 percent, and the median rose 0.7 percent, while the HPI declined 3.7 percent. On Bowen, where a relatively small number of widely varied properties make up the market, average and median prices can move considerably depending on what happens to sell. The HPI is therefore a better indication of the direction of underlying values.
Overall, the October figures suggest a market that is more active but still price sensitive. More homes are selling than in either of the previous two years, marketing times have improved, and dollar volume has strengthened considerably. At the same time, benchmark values remain under pressure. Buyers are participating, but they continue to be selective about value, making realistic pricing particularly important for sellers.
One caution with October’s figures is that the newsletter includes pending sales in several 2026 statistics, so the final closed-sale totals may change slightly.
On a last-twelve-month basis, there were 66 detached-home sales, up from 59 a year earlier and 49 in 2024. Dollar volume also increased substantially, reaching $114.3 million, compared with $94.3 million last year and $75.5 million two years ago. The average sale price rose to $1.732 million, while the median increased modestly to $1.495 million.
Year-to-date activity is also ahead of recent years. Through October there were 59 sales, compared with 52 in 2025 and 40 in 2024, while dollar volume reached approximately $103.9 million. New listings have also increased, however, with 158 properties coming to market year-to-date compared with 151 last year.
The Home Price Index tells a more restrained story. Bowen’s benchmark price was 3.7 percent lower than a year ago, although this represents a slight improvement from the 4.0 percent annual decline reported in September. The benchmark remained at approximately $1.402 million, unchanged from September. Bowen nevertheless continued to outperform most Metro Vancouver municipalities in terms of price stability, with only Lions Bay and Squamish recording stronger year-over-year HPI results among the markets shown.
The contrast between stronger sales statistics and a declining benchmark remains important. Over the last twelve months the average sale price increased 7.2 percent, and the median rose 0.7 percent, while the HPI declined 3.7 percent. On Bowen, where a relatively small number of widely varied properties make up the market, average and median prices can move considerably depending on what happens to sell. The HPI is therefore a better indication of the direction of underlying values.
Overall, the October figures suggest a market that is more active but still price sensitive. More homes are selling than in either of the previous two years, marketing times have improved, and dollar volume has strengthened considerably. At the same time, benchmark values remain under pressure. Buyers are participating, but they continue to be selective about value, making realistic pricing particularly important for sellers.
One caution with October’s figures is that the newsletter includes pending sales in several 2026 statistics, so the final closed-sale totals may change slightly.
MONTH OF SEPTEMBER 2026 DETACHED HOMES
SALE PRICE vs LIST PRICE
Low $1,660,000 $1,980,000
High $2,040,000 $2,195,000
Average Sale in September $1,850,000
Median Sale in September $$1,850,000
BOWEN REAL ESTATE is published monthly.
Timothy Rhodes REALTOR®
MLS® / SALES DATA DISCLAIMER: Based on Greater Vancouver REALTORS® MLS® data for Metro Vancouver, OCTOBER 2026.
LIMITATION DISCLAIMER: Historical data is for informational purposes only and does not guarantee future results.
DISCLAIMER: This communication is not intended to cause or induce breach of an existing agency agreement.
Although this information has been received from sources deemed reliable, we assume no responsibility for its accuracy, and without offering advice, make this submission to prior sale or lease, change in price or terms, and withdrawal without notice.
WE DO NOT SPAM.
You will only receive email related to the STATS ON BOWEN monthly reports and the occasional update.
Should you wish to no longer receive future real estate information, please inform me and I will remove your name from my database.
*If you no longer wish to receive emails from me, please reply to this email with the word ‘Unsubscribe’ in the subject line.