The number of sales and the price paid has increased steadily since July of 2020 with YoY metrics setting new records, including MLS® HPI, median and average sold price, median and average price per square foot, number of sales, and dollar volume. The low1est price paid for waterfront property YoY was $2.6 million (excluding a 137 acre outlier), and the average price paid was $3.2 million. The average lot size was 0.9 acres.
Inventory remains very low going into the summer season. Inventory in the month of May 2020 was two-and-a-half times that of May 2021. As of this writing, one third of the 17 detached homes for sale are listed under $21.5 million and only one is listed under $1.0 million.
Compared with Metro Vancouver, Bowen remained in the middle of the pack with a YoY MLS HPI® of $1.174 million, within $2,300 of the mean of $1.176 million for Metro municipalities.
As we enter June and the increase in the ‘stress test’ to 5.25 per cent from 4.79 per cent comes into play, although forecasters are not anticipating this change to have a dramatic impact on sales. At the date of this writing, the number of sales on Bowen Island is on track to match those in May.
During May, the Bowen market showed no indication that the current pace was calming, and although some is to be anticipated in the coming months, in May buyers paid on average 98.5 per cent of the list price.
Bowen remained a strong sellers’ market moving into summer.
MONTH OF MAY - DETACHED HOMES
SALE PRICE vs LIST PRICE
Low $910,000 vs $926,000
High $13,600,000 vs $12,950,000
Average Sale: $1,456,263
Median Sale: $1,720,000
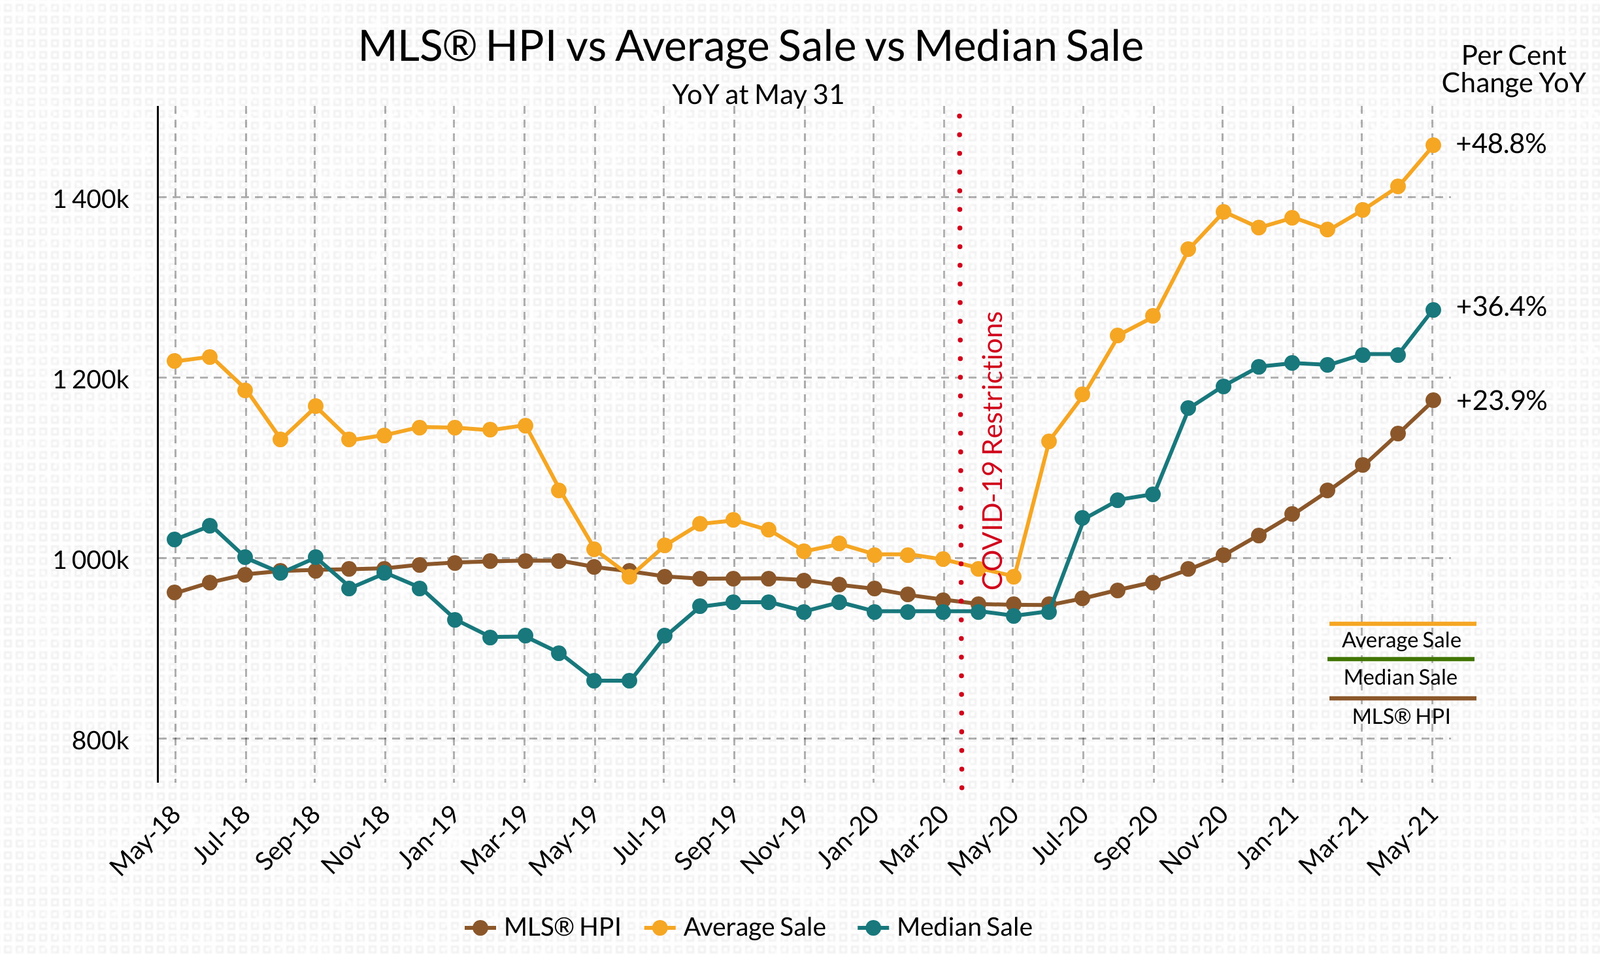
YoY INDICATORS
MLS®HPI: $1,173,525
Average Price: $1,456,263
Median Price: $1,275,000
LOTS - AVERAGE SALE RANGE YoY
$13.45–$7.68 per sq. ft.
STATS ON BOWEN is an analysis of the detached home market activity on Bowen Island
Published early- to mid-month of the month following.
If you would like STATS ON BOWEN sent to your inbox,you can SUBSCRIBE HERE free of charge.WE DO NOT SPAM.
You will only receive email related to the STATS ON BOWEN monthly reports.