Average Sale Price down -7.3% from August 2024
August closed with steady activity and a slight tilt toward a more balanced market. We saw 6 closed and pending sales, just ahead of last year, alongside a 19% increase in new listings. Buyers have more to choose from, and properties are taking longer to sell—average days on market rose to 76 days, up from 57 last August.
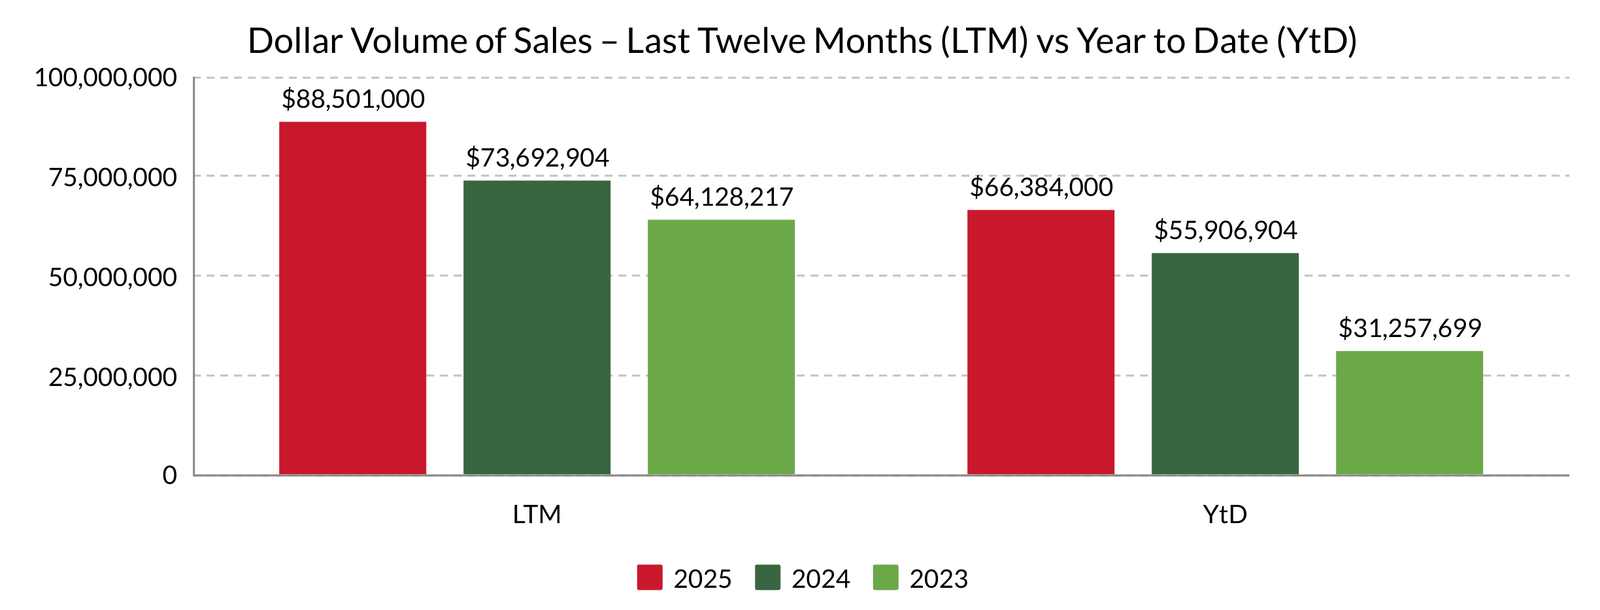
Despite the slower pace, overall dollar volume climbed to $11.46M, a 13% gain year-over-year, and year-to-date sales
volume sits nearly 19% higher than 2024. Prices remain remarkably steady: the average sale price was $1.76M, and
the median was virtually identical at $1.76M, reflecting healthy demand across price points.
volume sits nearly 19% higher than 2024. Prices remain remarkably steady: the average sale price was $1.76M, and
the median was virtually identical at $1.76M, reflecting healthy demand across price points.
Over the last twelve months, sales are up almost 30%, with a comparable rise in new listings keeping inventory in balance. Down -7.3 per cent, Bowen Island ranked last in Metro Vancouver average sale price growth over the last twelve months, underscoring the continued downward pressure on prices.
As we move into the fall market, sellers should focus on accurate pricing and strong presentation to attract
motivated buyers. Buyers now have more selection and negotiating power, though unique and well-priced homes
can still draw competition.
motivated buyers. Buyers now have more selection and negotiating power, though unique and well-priced homes
can still draw competition.
AUGUST 2025 DETACHED HOMES
SALE PRICE vs LIST PRICE
Low $1,195,000 $1,249,000
High $2,317,500 $1,390,000
Average Sale in August $1,755,833
Median Sale in August $1,755,500
STATS ON BOWEN
is published monthly once all data for the previous month has been received.
WE DO NOT SPAM.
You will only receive email related to the STATS ON BOWEN monthly reports and the occasional update.