A Small Market, A Steady Course
The March 2026 Bowen Island stats offer a useful reminder of how quickly this market can shift month-to-month—while at the same time reinforcing how little those short-term movements change the broader story.
Starting with pricing, the average sale price in March came in at approximately $1.69M, down from $2.00M in February. At first glance, that appears to be a notable decline, but in a market with very few transactions, this kind of movement is typically driven by the mix of homes sold rather than any meaningful change in underlying value. This is supported by the MLS® HPI, which remained relatively stable, with only a slight month-over-month shift of -0.3 percent.
Looking at the more reliable LTM data, the story is essentially unchanged. The average sale price held steady at $1.66M, unchanged from February, indicating that the longer-term pricing trend remains flat rather than rising or falling. Similarly, LTM dollar volume edged slightly lower from approximately $93.1M to $91.5M, suggesting a marginal softening in overall activity rather than any sharp shift.
Sales activity in March slowed meaningfully compared to February. There were just 3 sales against 11 new listings, compared to 6 sales and 10 listings the month prior. This points to a temporary widening gap between supply and demand and reinforces the idea that buyers remain selective. However, on an LTM basis, sales (55 vs. 56) and listings (153 vs. 161) are largely stable, again highlighting the importance of the longer view.
Days on market offer an interesting counterpoint. While February showed an increase, March saw a modest month-over-month decline of roughly 3.8 percent, suggesting that well-priced homes are still moving, even if overall activity is subdued.
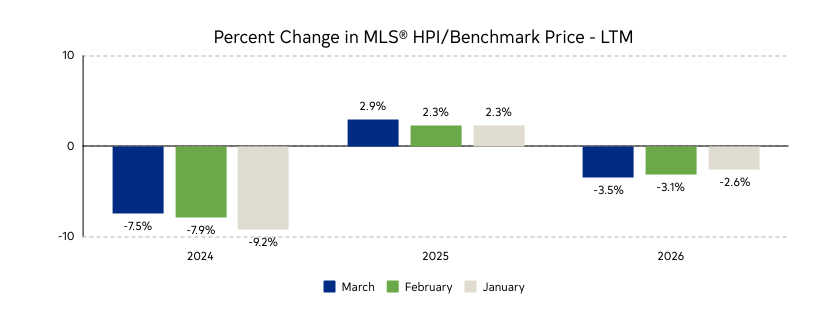
Within the broader Metro Vancouver context, Bowen continues to sit near the middle of the pack, with a roughly -3.5 percent year-over-year HPI change—very similar to February’s -3.1 percent. This consistency reinforces the idea of a market that is adjusting but not correcting sharply.
Overall, March doesn’t signal a new direction so much as it reinforces the current one. Month-to-month volatility remains high, but the underlying trend is steady: a balanced market with modest downward pressure on values, patient buyers, and a growing need for precision on the seller side.
MARCH 2026 DETACHED HOMES
SALE PRICE vs LIST PRICE
Low $1,501,000 $1,499,000
High $1,870,000 $1,870,000
Average Sale in Mar $1,685,500
Median Sale in Mar $1,685,500
STATS ON BOWEN is published monthly.
Timothy Rhodes REALTOR®
** Audio is Ai generated.
MLS® / SALES DATA DISCLAIMER:
Based on Greater Vancouver REALTORS® MLS® data for Metro Vancouver, February 2026.
LIMITATION DISCLAIMER:
Historical data is for informational purposes only and does not guarantee future results.
Although this information has been received from sources deemed reliable, we assume no responsibility for its accuracy, and without offering advice, make this submission to prior sale or lease, change in price or terms, and withdrawal without notice.
WE DO NOT SPAM.
You will only receive email related to the STATS ON BOWEN monthly reports and the occasional update.