This snapshot of real estate year-over-year shows a definite cooling of Metro Vancouver’s over-heated detached-home market. Generally, across the Real Estate Board of Greater Vancouver (REBGV). the median sales price is holding but flat, sales are sluggish, both dollar volume and sales volume are down almost 30%, and the number of new listings is down.
Several areas in the REBGV, most notably Bowen Island, Squamish, the Sunshine Coast, and Whistler bucked the trend and showed MLS® Housing Price Index increases over 20 per cent. As an internationally recognized resort, Whistler has a level of built-in protection from market fluctuations. In the case of Bowen, the Sunshine Coast, and Squamish, growth can be attributed to buyers looking for alternatives to the high real estate prices and traffic congestion of the Lower Mainland. However, in small communities the impact of just a few outlier sales can have a significant impact on the statistics; a factor which could account for some of the dramatic differences illustrated below. Notwithstanding this, the numbers do show that in most categories Bowen Island is up where the REBGV is up, and down where REBGV is down.
There were 58 detached-home sales on Bowen Island from 1 November 2016 through 31 October 2017. For purposes of comparison with REBGV, the 12 vacant land properties sold over this period are not included in these statistics. Statistics are for closed sales of MLS® listed detached homes year-over-year unless noted otherwise.
REAL ESTATE PER CENT CHANGE — DETACHED-HOMES — 1 Novmeber 2016 - 30 October 2017
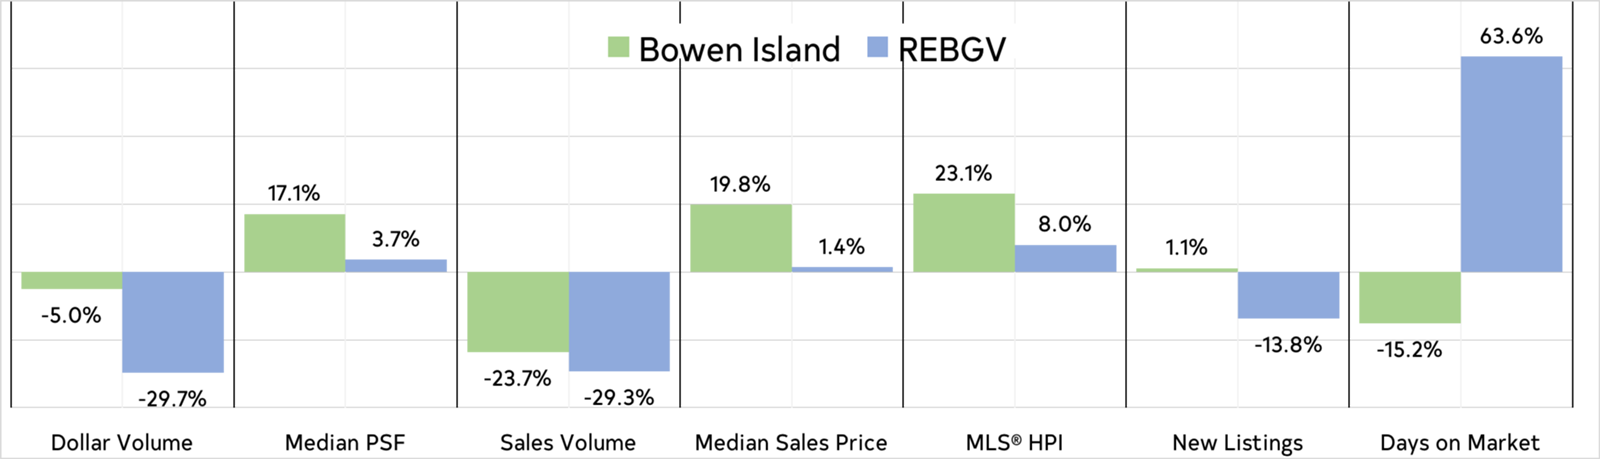
Dollar Volume: DOWN
34 Bowen Island homes sold for less than $1 million and 24 sold for more than $1 million, with a total sales volume of $62,520,200, down 5 per cent. West Vancouver took the biggest hit over the last year with the dollar volume of closed sales down 47.6 per cent.
Median Price per Sq. Ft.: UP
Properties between $800,000 and $1.4 million accounted for just over half of all sales and the median price paid per square foot was $494, up 17.1 per cent.
Sales Volume: DOWN
The number of sales on Bowen Island dropped 23.7 per cent, while sales across the REBGV jurisdiction dropped 29.3%. Given that new listings and dollar volume was relatively flat, the drop sales volume on Bowen can be attributed to the backlog from 2009 which was sold prior to this year.
Median Sales Price: UP
Bowen’s increase in median sales price, up 19.8% year over year (tied with New Westminster), was surpassed only by the Sunshine Coast at 23.6 per cent and Whistler at 24.7 per cent.
MLS® House Price Index: UP
At 23.6 per cent, Bowen Island was one of 4 areas with increases over 20.0 per cent, second only to Squamish at 24.3 per cent, and ahead of the Sunshine Coast at 23.1 per cent and Whistler at 21.2 per cent.
New Listings: UP
Bowen Island saw 91 new listings over the past year, up 1.1 per cent from the total for the previous year. Most areas in the REBGV were down.
Days on Market: DOWN
The median number of days on the market for a home on Bowen was down by 15.2 per cent, although the median as of 20 November 2017 is 78 days, suggesting the quick sale is still relatively rare.
In this market is questionable whether one can predict the future from the past. Bowen Island property has more than regained value lost after the 2009 slump, but it may be unrealistic to anticipate the rate of growth seen since 2014 to continue, especially given that ongoing changes to mortgage requirements, like the OSFI Stress Test coming on-stream in January of 2018, effectively reduce buying power for many. However, as density and congestion throughout the Lower Mainland escalates, the appeal Bowen Island as a place of respite, combined with its proximity and limited inventory, should help to safeguard the equity in property, if not its rate of growth.
Data source: Real Estate Board of Greater Vancouver (http://www.rebgv.org). Data deemed reliable but not guaranteed.
Several areas in the REBGV, most notably Bowen Island, Squamish, the Sunshine Coast, and Whistler bucked the trend and showed MLS® Housing Price Index increases over 20 per cent. As an internationally recognized resort, Whistler has a level of built-in protection from market fluctuations. In the case of Bowen, the Sunshine Coast, and Squamish, growth can be attributed to buyers looking for alternatives to the high real estate prices and traffic congestion of the Lower Mainland. However, in small communities the impact of just a few outlier sales can have a significant impact on the statistics; a factor which could account for some of the dramatic differences illustrated below. Notwithstanding this, the numbers do show that in most categories Bowen Island is up where the REBGV is up, and down where REBGV is down.
There were 58 detached-home sales on Bowen Island from 1 November 2016 through 31 October 2017. For purposes of comparison with REBGV, the 12 vacant land properties sold over this period are not included in these statistics. Statistics are for closed sales of MLS® listed detached homes year-over-year unless noted otherwise.
REAL ESTATE PER CENT CHANGE — DETACHED-HOMES — 1 Novmeber 2016 - 30 October 2017
Dollar Volume: DOWN
34 Bowen Island homes sold for less than $1 million and 24 sold for more than $1 million, with a total sales volume of $62,520,200, down 5 per cent. West Vancouver took the biggest hit over the last year with the dollar volume of closed sales down 47.6 per cent.
Median Price per Sq. Ft.: UP
Properties between $800,000 and $1.4 million accounted for just over half of all sales and the median price paid per square foot was $494, up 17.1 per cent.
Sales Volume: DOWN
The number of sales on Bowen Island dropped 23.7 per cent, while sales across the REBGV jurisdiction dropped 29.3%. Given that new listings and dollar volume was relatively flat, the drop sales volume on Bowen can be attributed to the backlog from 2009 which was sold prior to this year.
Median Sales Price: UP
Bowen’s increase in median sales price, up 19.8% year over year (tied with New Westminster), was surpassed only by the Sunshine Coast at 23.6 per cent and Whistler at 24.7 per cent.
MLS® House Price Index: UP
At 23.6 per cent, Bowen Island was one of 4 areas with increases over 20.0 per cent, second only to Squamish at 24.3 per cent, and ahead of the Sunshine Coast at 23.1 per cent and Whistler at 21.2 per cent.
New Listings: UP
Bowen Island saw 91 new listings over the past year, up 1.1 per cent from the total for the previous year. Most areas in the REBGV were down.
Days on Market: DOWN
The median number of days on the market for a home on Bowen was down by 15.2 per cent, although the median as of 20 November 2017 is 78 days, suggesting the quick sale is still relatively rare.
In this market is questionable whether one can predict the future from the past. Bowen Island property has more than regained value lost after the 2009 slump, but it may be unrealistic to anticipate the rate of growth seen since 2014 to continue, especially given that ongoing changes to mortgage requirements, like the OSFI Stress Test coming on-stream in January of 2018, effectively reduce buying power for many. However, as density and congestion throughout the Lower Mainland escalates, the appeal Bowen Island as a place of respite, combined with its proximity and limited inventory, should help to safeguard the equity in property, if not its rate of growth.
Data source: Real Estate Board of Greater Vancouver (http://www.rebgv.org). Data deemed reliable but not guaranteed.