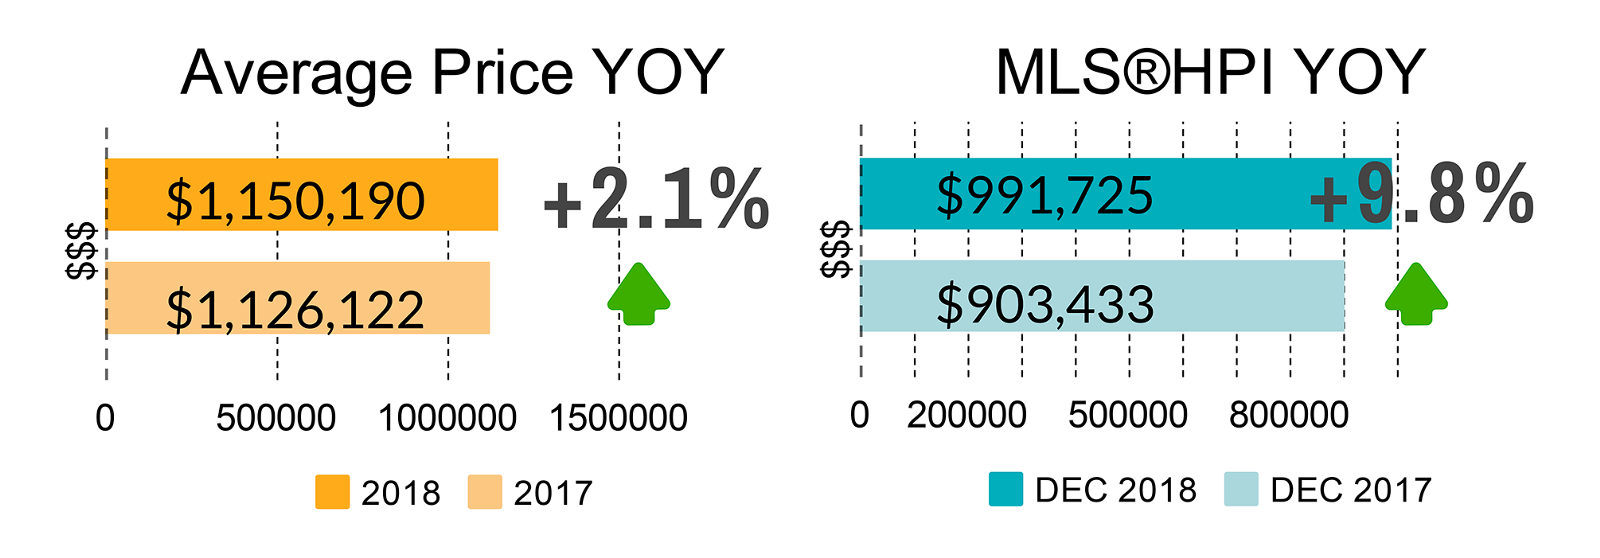
The market for detached properties on Bowen Island continues to be slow and flat, with only one sale recorded for the month of December. The Number of Sales for 2018 was the lowest since 2013, down 13.4 per cent compared to 2017 while Dollar Volume of Sales was down 11.5 per cent but still above 2016 levels. The Median Price year-over-year (YOY) compared to 2017 was down 2.9% while both the Average Price and MLS®HPI (or Benchmark Price) were up 2.1 and 9.8 per cent respectively, indicating prices are not dropping but lower price properties made up the bulk of the sales. The Metro Vancouver market did not fare as well with the Number of Sales the lowest since the year 2000 and Dollar Volume below 2013 levels.
There were 27 active listing on Bowen at December 31, ranging from $739,000 to $3,900,000 and averaging 117 days
on market, compared to the REBGV average of 56 days. The December Benchmark (MLS®HPI) price was up 5.0 per cent forBowen Island and down 7.8% for the REBGV.
on market, compared to the REBGV average of 56 days. The December Benchmark (MLS®HPI) price was up 5.0 per cent forBowen Island and down 7.8% for the REBGV.
Two Metro municipalities had positive change in the December Benchmark price: Bowen Island at 5.0 per cent and Pitt Meadows at 2.0 per cent with the Benchmark price in the two municipalities at $1,001,800 and $912,000 respectively.
The most expensive neighbourhoods experienced double-digit negative change: West Vancouver down 13.5 per cent and Vancouver West down 11.8 per cent with Benchmark prices at $2,674,700 and $3,135,400 respectively.
On Bowen the Number of Sales as a Percentage of Number of Listings in December 2018 was 3.6 per cent, half that of
October 2018, and for the same period the YOY Median Sales Price was down 2.9%. The Average and MLS®HPI (Benchmark) Sales Price were up 2.1 and 9.8 percent respectively, while the YOY selling price on Bowen averaged 94.0 per cent of the list price in 2018 compared to 98.0 per cent in 2017, indicating that buyers are driving harder deals.
October 2018, and for the same period the YOY Median Sales Price was down 2.9%. The Average and MLS®HPI (Benchmark) Sales Price were up 2.1 and 9.8 percent respectively, while the YOY selling price on Bowen averaged 94.0 per cent of the list price in 2018 compared to 98.0 per cent in 2017, indicating that buyers are driving harder deals.
Patience is a virtue for sellers as we enter 2019.
Bowen Island YOY at 31 December 2018:
• MLS®HPI: $991,725.
• Median Sales Price: $ 930,750.
• Average Sales Price: $1,150,190.
• MLS®HPI: $991,725.
• Median Sales Price: $ 930,750.
• Average Sales Price: $1,150,190.
STATS ON BOWEN is a detailed analysis published monthly once all data for the month has been reported.
For example, the January report would be published during the last week of February.
If you would like early access to the report during the first week of the month,
you can SUBSCRIBE HERE free of charge.