Dollar volume of sales YtD (year-to-date) at 31 March 2019 underscores this reluctance: the dollar volume of $3,495,000 was less than one-quarter that of the same period in 2018, while the number of sales YtD was one-third that of the previous year.
This reluctance is also reflected in a 35.4 per cent increase YoY in average days on market (65 vs 48 days based on properties sold) compared to the same period in 2018, and a YtD increase of 161.8 per cent (89 vs 35 days) over 2018.
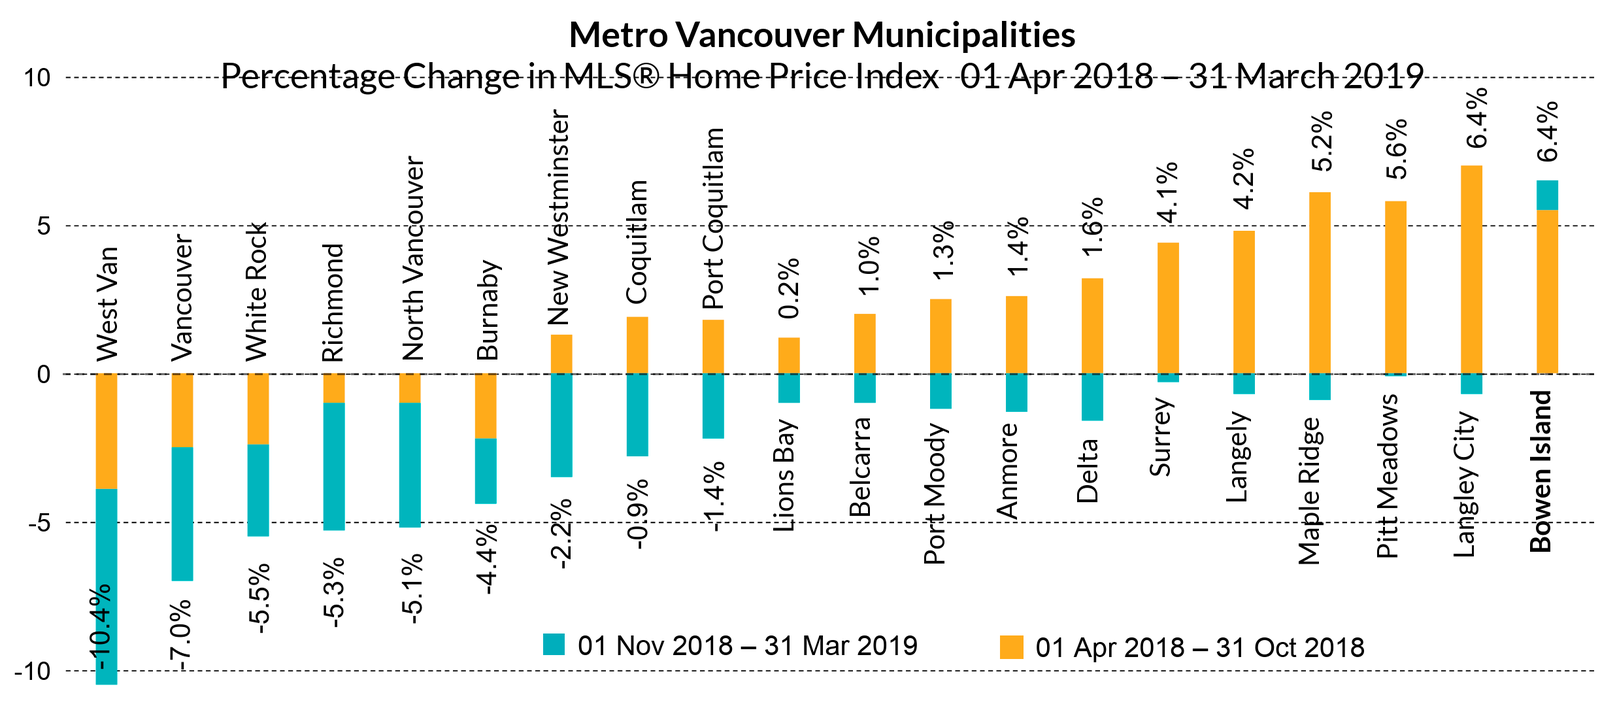
No sales closed for Bowen Island in March. At the end of March, the MLS®Home Price Index for Bowen Island was up 6.4 per cent YoY (year-over-year) and Bowen Island was the only municipality in Metro to show a YoY increase from 1 November 2018 to 31 March 2019; however, this is not the indication of stability it might appear to be. This 6-month increase accounted for only 15 per cent of the total—85 per cent of the YoY increase occurred in the 6 months prior to 1 November 2018. In the first quarter of 2019, the MLS®HPI for Bowen increased 0.21 per cent, one-tenth of the increase during the same period in both 2017 and 2018.
No sales closed for Bowen Island in March. At the end of March, the MLS®Home Price Index for Bowen Island was up 6.4 per cent YoY (year-over-year) and Bowen Island was the only municipality in Metro to show a YoY increase from 1 November 2018 to 31 March 2019; however, this is not the indication of stability it might appear to be. This 6-month increase accounted for only 15 per cent of the total—85 per cent of the YoY increase occurred in the 6 months prior to 1 November 2018. In the first quarter of 2019, the MLS®HPI for Bowen increased 0.21 per cent, one-tenth of the increase during the same period in both 2017 and 2018.
Bowen’s growth curve is flat and the curve for the REBGV is trending down, with the 31 March MLS®HPI falling to that of mid-summer 2018. Buyers will bring this knowledge to their negotiations. Sellers on Bowen Island should recognize that this is a buyer’s market and anticipate a greater spread between the offer and the list price than in recent years.
Bowen Island YOY at 31 March 2019:
• MLS®HPI: $996,142
• Median Sales Price: $974,250
• Average Sales Price: $1,106,030
• MLS®HPI: $996,142
• Median Sales Price: $974,250
• Average Sales Price: $1,106,030
STATS ON BOWEN is a detailed analysis published monthly once all data for the month has been reported.
For example, the January report would be published during the last week of February.
If you would like early access to the report during the first week of the month,