Sales on Bowen Island during April continued to be flat with only 10 sales from November 2018 through April 2019. The number of sales year-over-year (YoY) was down (31.8 per cent) and year-to-date (YtD) was down (-65.0 per cent), while dollar volume of sales was down year-over-year (-42.9 per cent) and year-to-date (-72.4 per cent). These significant reductions were underlined by an increase in the median days on market of 86.4 per cent.
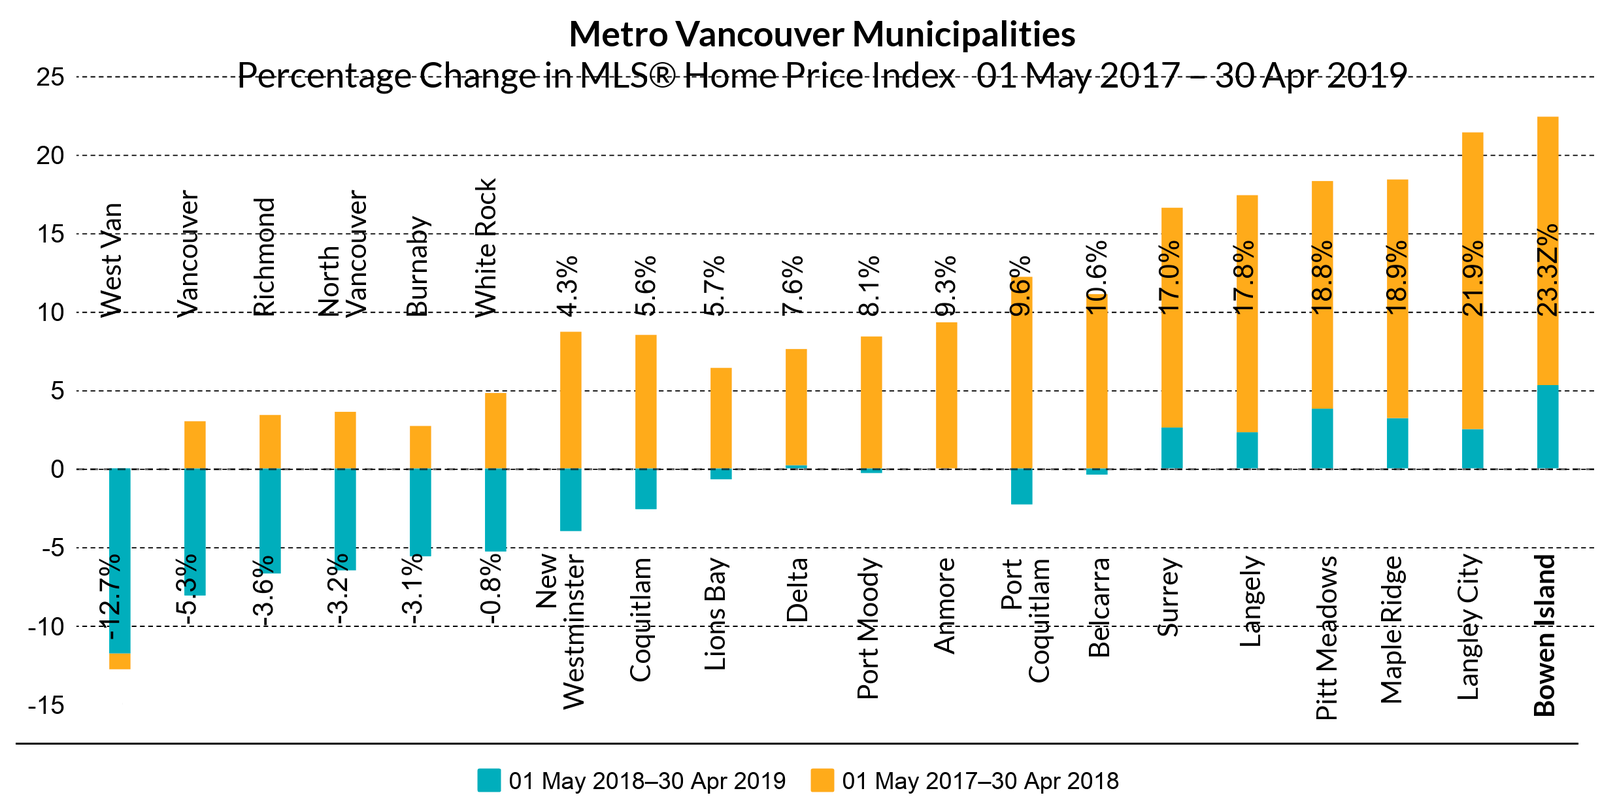
In 14 of 20 Metro Vancouver municipalities, the MLS®HPI (Home Price Index) was down YoY (May 1 2018–April 30 2019) with the largest decrease in West Vancouver (-11.8 per cent). Eight municipalities showed growth in the MLS®HPI with the largest YoY increase in +5.3 per cent on Bowen Island. While the MLS®HPI on Bowen was up, both the median sale price and average sale price YoY were down (-14.3 per cent and -16.3 per cent respectively). Growth in the MLS®HPI has slowed, down from 17.7 per cent YoY in 2018 to 5.3 per cent YoY in 2019. Seventy per cent of Metro municipalities showed a drop in MLS®HPI YoY value from the same period a year ago, while 30 per cent showed an increase. It will not serve buyers or sellers to make assumptions based on general statistics or media reports for the larger REBGV region.
Bowen’s growth curve remained flat YoY while the REBGV continued to trend down, reaching April 2017 levels.
BOWEN ISLAND YOY STATS
30 April 2019: 31 March 2019:
• MLS®HPI: $995,992 • MLS®HPI: $996,142
• Median Price: $870,000 • Median Price: $974,500
• Average Price: $1,012,266 • Average Price: $1,060,030
• MLS®HPI: $995,992 • MLS®HPI: $996,142
• Median Price: $870,000 • Median Price: $974,500
• Average Price: $1,012,266 • Average Price: $1,060,030
STATS ON BOWEN is a detailed analysis published monthly once all data for the month has been reported.
For example, the January report would be published during the last week of February.
If you would like early access to the report during the first week of the month,