Although still well below the 3-year highs and down year-over-year,September price indicators continued to show signs of stability when compared with August and July of this year. The YoY Average Sales price was up +2.9 per cent from July 2019 and up +0.3 per cent from August 2019. If this trend continues, YoY price indicators could be close to or on par with those of December 2018 by the end of this year.
Comparing the month of September 2018 to September 2019, the Average Price was down -7.4 per cent, and comparing year-over-year (12 months from October through September), the Average Price was down -7.2 per cent. The market still lags well behind 2018 for Dollar Volume and total Number of Sales, but the gap continues to narrow. In September YoY Dollar Volume was at Q1 2015 levels compared to Q3 2014 levels in August, and the Number of Sales was at Q2 2014
levels compared to Q3 2012 levels in August.
Sales continued slow with the YoY September 2019 Average Days on Market at 85, 54.5 per cent higher than September 2018. YtD, Average Days on Market was 82, 67.3 per cent higher than September 2018.
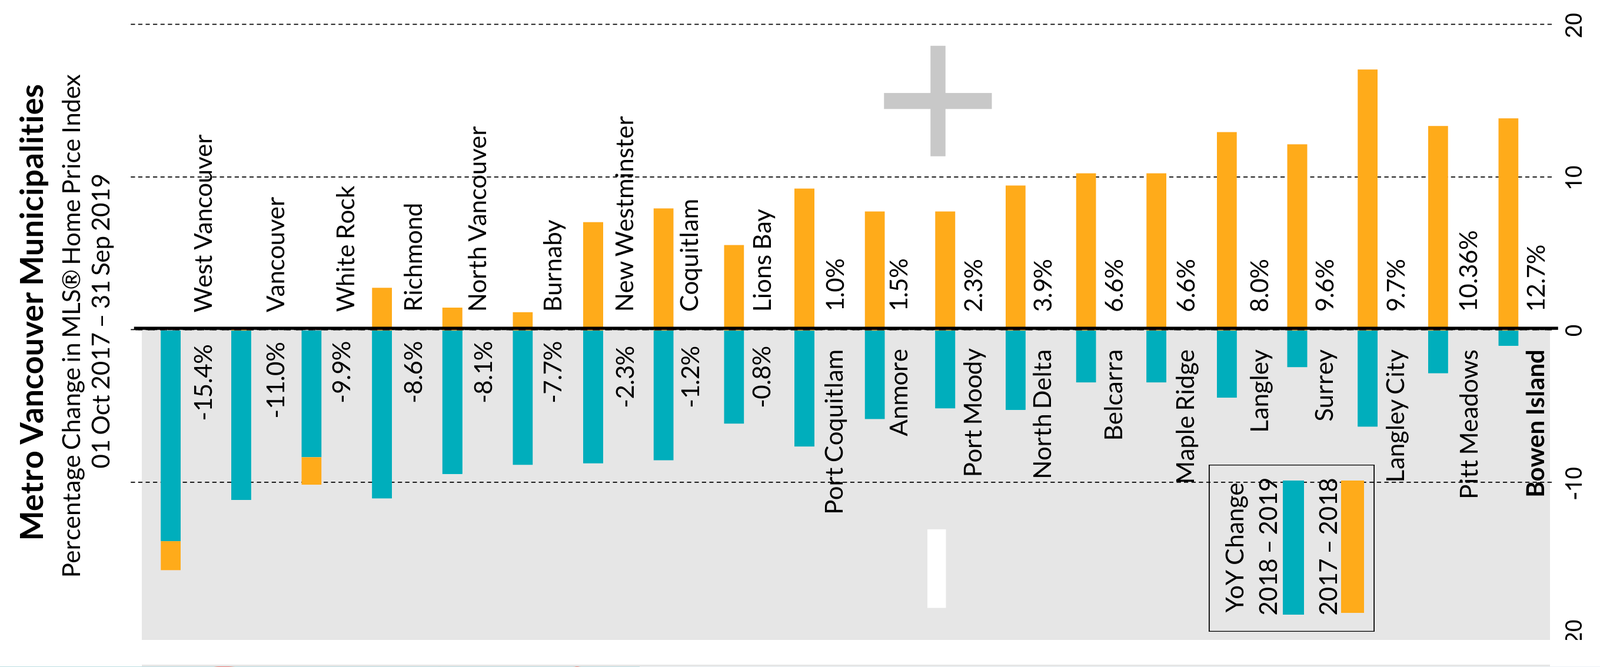
Bowen Island real estate continues to lead Metro municipalities in the MLS® Home Price Index. In September Bowen’s YoY MLS® HPI was up 12.7 per cent from 2017 followed by Pitt Meadows at 10.4 percent, while Richmond, North Vancouver, White Rock, Vancouver, and West Vancouver ranged from -8.1 per cent to -15.4 per cent over the same period.
BOWEN ISLAND YOY STATS
@30 September 2019
MLS®HPI: $976,192
Median Price: $950,000
Average Price: $1,043,012
@31 August 2019
MLS®HPI: $985,800
Median Price: $995,500
Average Price: $1,166,661
@30 September 2019
MLS®HPI: $976,192
Median Price: $950,000
Average Price: $1,043,012
@31 August 2019
MLS®HPI: $985,800
Median Price: $995,500
Average Price: $1,166,661
STATS ON BOWEN is a detailed analysis published monthly once all data for the month has been reported.
For example, the January report would be published during the last week of February.
For example, the January report would be published during the last week of February.
If you would like early access to the report during the first week of the month,