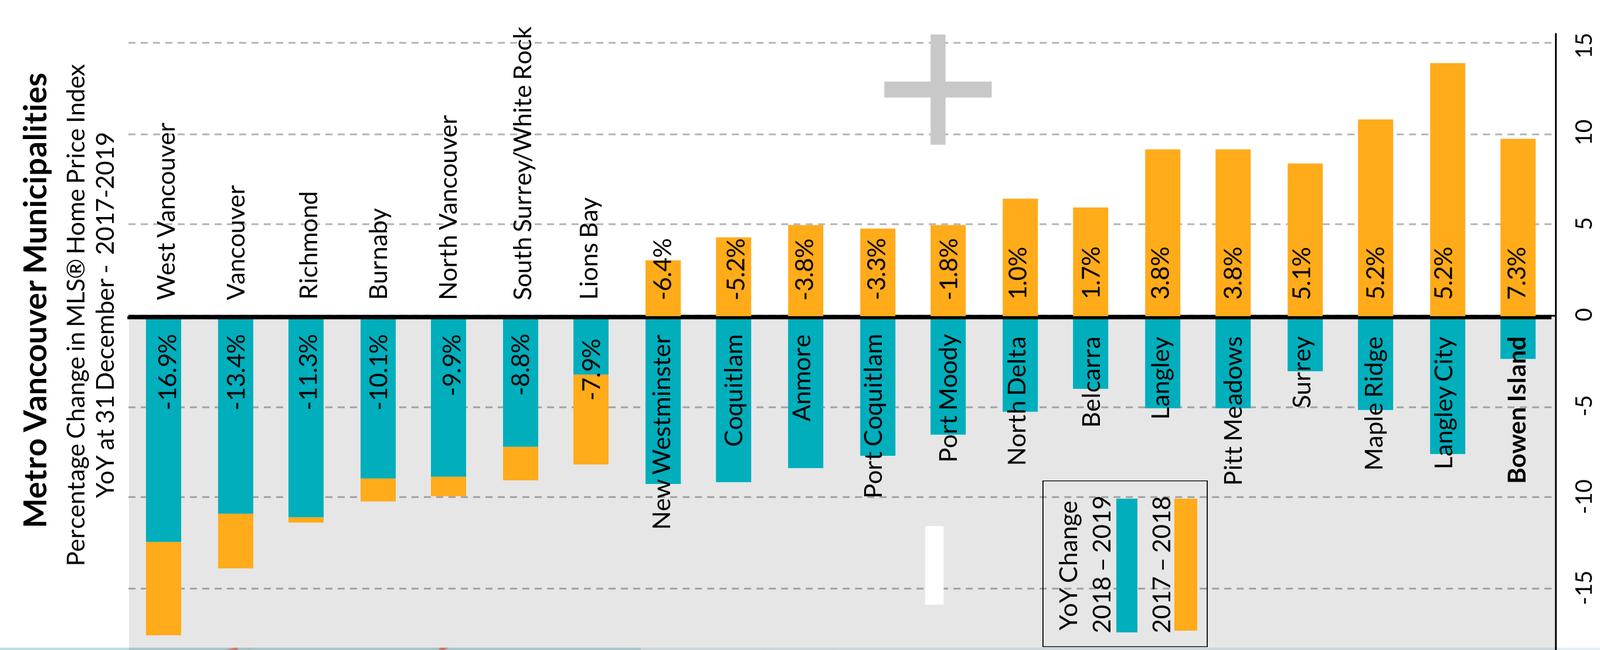
The 2019 YoY MLS® HPI ($969,150) was down a modest -2.3 per cent from the record high in 2018, performing better for this metric than all other Metro municipalities.
There were 88 new listings in 2019 and 45 sales. As of 7 January 2020, there are 15 listings for detached homes on Bowen Island: one-third are listed under $900,000, one-third between $900,000 and $1.2 million, and one-third above $1.5 million.
The MLS® HPI was down only slightly at -2.3 per cent, while the Average Sale Price and Average Price per Square Foot were down -11.3 and -23.1 per cent respectively. Market forces like the mortgage stress test eroded the buying power of those looking for a home and gave the advantage to homes listed at lower prices. Of the 45 homes sold in 2019, 25 or 56 per cent sold under $1 million and one-third of those sold under $800,000. Another 31 per cent sold at prices between $1 million and $1.4 million and 13 per cent of homes sold for between $1.4 and $1.5 million. The highest sale in 2019 was for $1,499,500 and the lowest was $620,000. One in four homes contained a suite.
A look at the last 5 years YoY at 31 December compared to 2019 shows 2018 with the highest MLS®HPI (down -2.3 per cent in 2019), the highest Average Sale Price (down -11.3 per cent in 2019), and the highest Average Price per Square Foot (down -23.1 per cent in 2019). The numbers show how slow the market was in 2019 with Number of Sales the lowest in 5 years, down -51.6 per cent from the high in 2015 and -22.4 per cent from 2018. Volume of Sales were also at a 5-year low: -40.1 per cent from the 5-year high in 2017 and down -29.9 per cent in 2018. Sale Price compared to List Price was more stable at 93.3 per cent in 2019, down -4.6 per cent from the 5-year high in 2016 and down -2.8 per cent from 2018.
The 2020 forecasts for the Real Estate Board of Greater Vancouver region (Lower Mainland/Southwest) from the BCREA (BC Real Estate Association) are for sales of detached homes to increase +14.5 per cent and the MLS® Average Price to increase +1.9 per cent.* The Central Credit Union predicts increases of +19.2 per cent and +3.6 respectively for the Vancouver CMA.**
Bowen Island lags several months behind Metro Vancouver trends; however, with mortgage rates predicted to remain favourable,*** the market is likely see similar increases in 2020.
BOWEN ISLAND YOY STATS
@31 December 2019
MLS®HPI: $969,150 (-0.06% from November)
Median Price: $950,000 (+ 1.1% from November)
Average Price: $1,014,626 (+0.08 % from November)
@31 November 2019
MLS®HPI: $985,800
MLS®HPI: $985,800
Median Price: $940,000
Average Price: $1,010,522
STATS ON BOWEN is a detailed analysis of activity on Bowen Island published monthly,
usually within seven days from the end of the month.
If you would like notice of the most recent STATS ON BOWEN sent to your inbox
you can SUBSCRIBE HERE free of charge.
you can SUBSCRIBE HERE free of charge.
WE DO NOT SPAM.
You will only receive email related to the STATS ON BOWEN monthly reports.
Lower Mainland/Southwest: Metro Vancouver, the communities in the Fraser Valley to the east, the towns of Squamish and Whistler to the north, and the Sunshine Coast.
Vancouver CMA: Area codes 604 / 778 / 236 / 672
* (https://www.bcrea.bc.ca/wp-content/uploads/housingforecast.pdf)
** https://www.central1.com/wp-content/uploads/2019/11/ECON_EA_BC_20190522.pdf
*** (https://www.bcrea.bc.ca/wp-content/uploads/housingforecast.pdf)Blog post content goes here