The seller's market continues
At 12.3 per cent, Bowen Island sits in the number two position across Metro Vancouver when comparing the YoY increases in benchmark price from 2017-2020. Langley City held the number one position at 13.9 per cent. West Vancouver decreased -14.4 per cent.
Bowen Island’ benchmark price, YoY 2019-2020, increased 2.8 per cent. Langley City led the increase in benchmark price at 6.7 per cent, and Anmore trailed at 0.5 per cent. West Vancouver registered a 2.4 per cent increase. Bowen’s YoY benchmark price has now exceeded its previous high in 2019.
The municipalities with lower benchmark prices have fared better than those with higher benchmark prices over the past three years; however, all municipalities have shown positive growth YoY.
Bowen has seen average, median, and MLS®HPI prices increase YoY since June 2020, and the average number of days on market has decreased dramatically from 64 days in 2019 to 29 days in 2020. Properties selling at greater than $1.5 million continue to account for a larger share of market—70 per cent YoY in 2020 compared to 62 per cent in 2019 and 54 per cent in 2018.
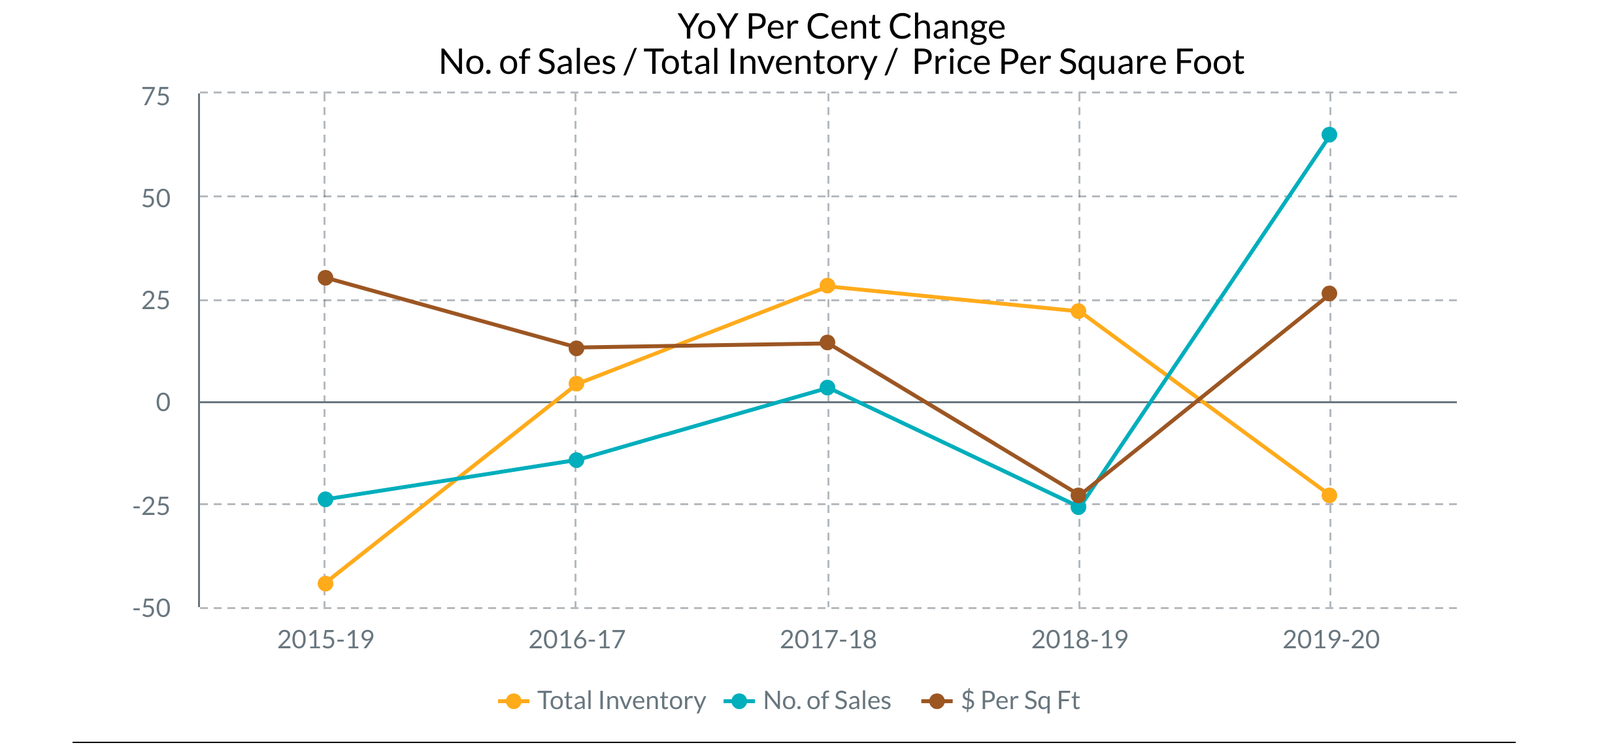
YoY inventory levels are the lowest in 3½ years and will continue to keep upward pressure on prices, and with only 19 homes on the market at this writing, sales may slow due to lack of inventory. Lot sales have increased YoY by 300 per cent compared to 2019, leaving only 11 lots currently for sale.
Bowen is in a seller’s market fueled by low inventory, the desire to escape from urban areas due to COVID, and historic low interest rates.
MONTH OF NOVEMBER
Detached Homes
SALE PRICE LIST PRICE
• Low $ 875,000* $ 875,000*
• High $1,525,000 $1,525,000
Average Sale: $1,077,000
Median Sale: $1,259,000
* House + adjacent lot
YoY Detached Homes
• MLS®HPI: $1,002,208
• Median Price: $1,065,000
• Average Price: $1,190,000
YoY Lots Average Sale Price
$5.49 to $13.52 per sq. ft.
STATS ON BOWEN is a detailed analysis of detached homes activity on Bowen Island.
Analysis is published monthly, mid– to late–month of the month following,
in order to provide the most accurate data.
If you would like early notice of STATS ON BOWEN sent to your inbox,
you can SUBSCRIBE HERE free of charge.
WE DO NOT SPAM.
You will only receive email related to the STATS ON BOWEN monthly reports.