2020 Year-end report – Benchmark price at new high
Vacant land saw also saw values increase YoY. At 31 December 2020, the Average Sale Price per Square Foot for vacant land was $10.17, an increase of 190 per cent over the same period in 2018 (the last year of positive growth). Nineteen vacant properties were sold for a Total Dollar Volume of $11.4 million, an increase of 433 per cent
over 2019. Waterfront and water-view lots made up half the total dollar volume.
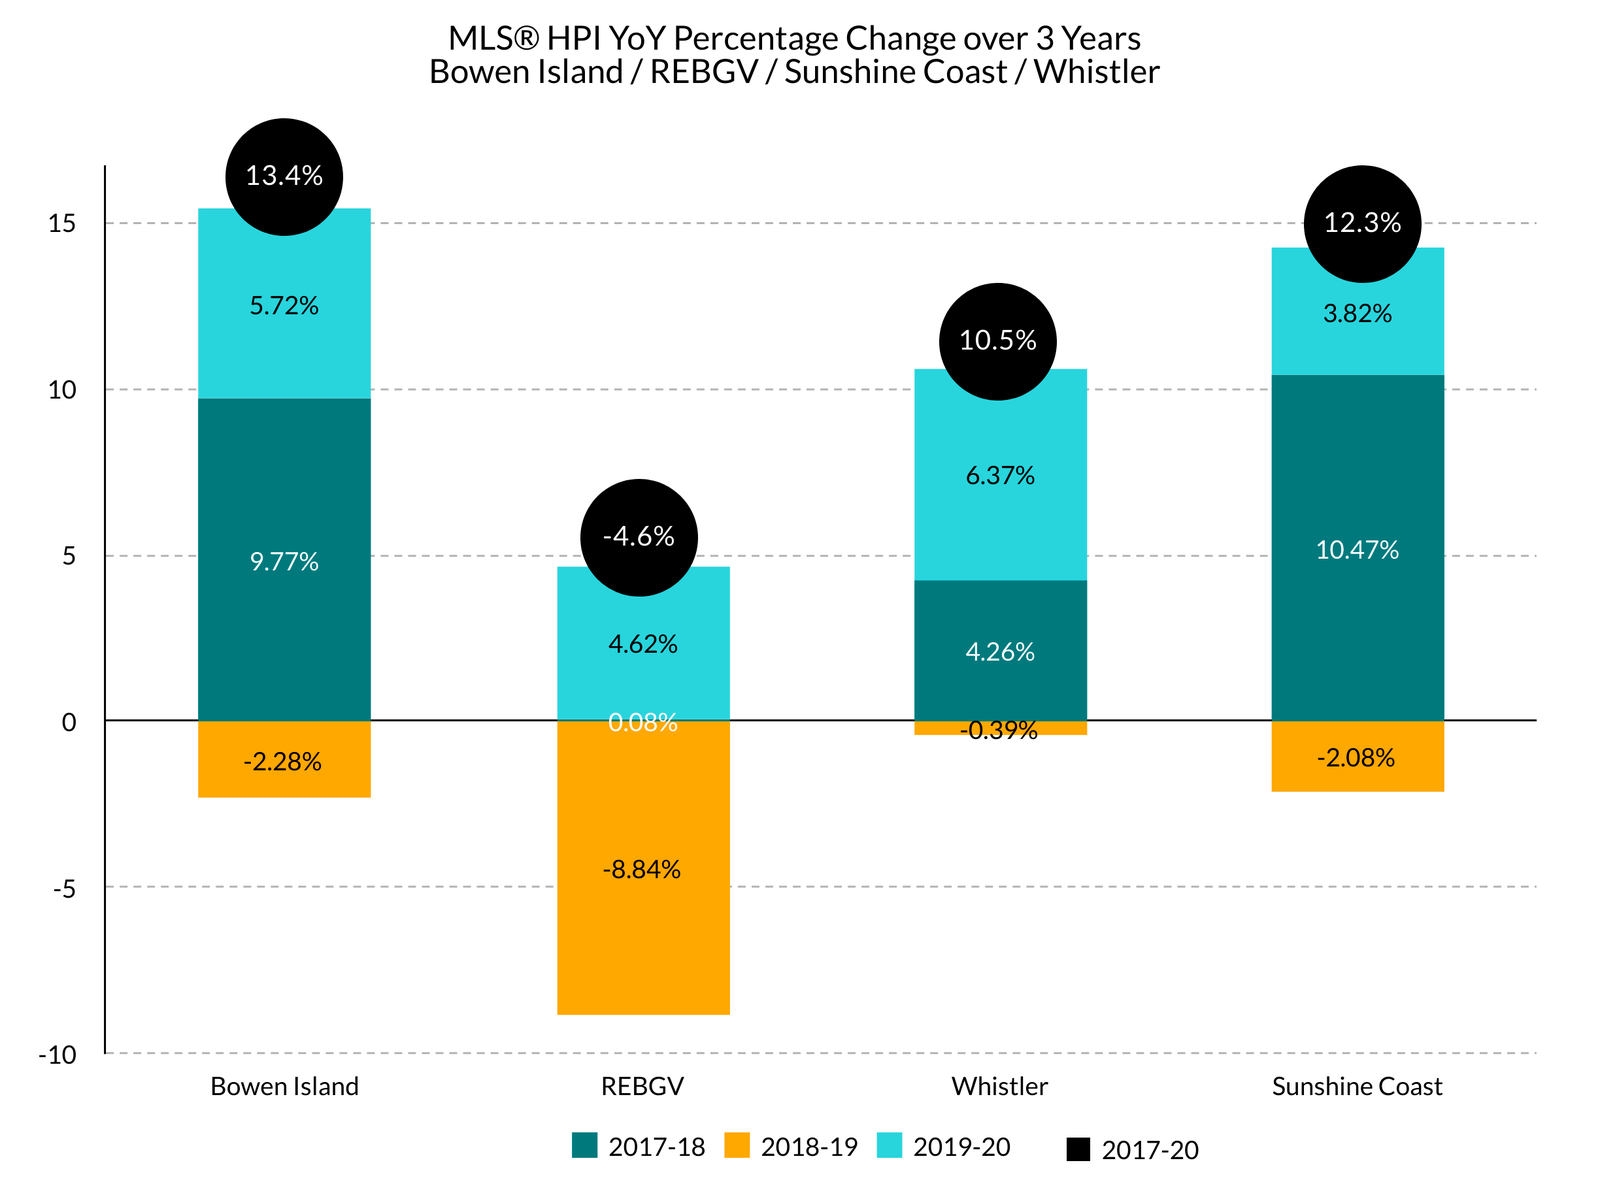
Comparing the YoY change in MLS® HPI for Metro Vancouver municipalities, Bowen ranked 7th highest at 5.7 per cent in 2020, showed the least decrease at -2.3 per cent in 2019, and ranked 4th at 9.8 per cent in 2018. Comparing the 3-year change in the benchmark price, Bowen ranked 2nd at 13.4 per cent. For the same period, the Bowen market outperformed the REBGV region which decreased by -4.6 per cent and the Sunshine Coast and Whistler region which increased by 10.5 per cent and 12.3 per cent respectively.
YoY the Number of Sales of detached homes (81) was up 38 per cent over 2018, just 12 sales below the record of 93 set in 2015. And for 12 months of activity ending 31 December 2020:
- The MLS® HPI or Benchmark price reached $1,024,542, up 3 per cent from the previous high of $991,725 for 2018.
- The Average Sale price reached $1,365,006, up 19 per cent from the previous high of $1,144,291 for 2018.
- The Median Sale price reached $1,211,000, up 25 per cent from the previous high of $966,000 for 2018.
- Dollar Volume of Sales reached $110,555,517, up 46 per cent from the previous high of $66,461,000 for 2018.
- Only the Average Price per Square Foot of $631 was down (-0.9 per cent) from the previous high of $637 for 2018, while the Median Price of $557 was up 5.9 per cent from the previous high of $526 for 2018.
* For the purposes of this report, year-over-year (YoY) represents the previous 12 months of activity. Without exception, all indicators for 2019 were down from 2020. As this skews statistics, 2018, a year with more positive indicators, was used for comparisons.
MONTH OF DECEMBER
Detached Homes
SALE PRICE LIST PRICE
Low $ 551,000 $ 564,000
High $1,525,000 $1,525,000
Average Sale: $6,150,000
Median Sale: $6,500,000
YoY Detached Homes
MLS®HPI: $1,024.542
Median Price: $1,211,000
Average Price: $1,365,006
YoY Lots Average Sale Price
$10.17 per sq. ft.
STATS ON BOWEN is a detailed analysis of detached homes activity on Bowen Island.
Analysis is published monthly, mid– to late–month of the month following,
in order to provide the most accurate data.
If you would like early notice of STATS ON BOWEN sent to your inbox,
you can SUBSCRIBE HERE free of charge.
WE DO NOT SPAM.
You will only receive email related to the STATS ON BOWEN monthly reports.