After a sharp increase in Average Sale Price from June through November 2020 (+39.2 per cent), the curve flattened and declined slightly (-1.5 per cent) December through February. Year-over-year the Average Sale Price was up by +35.8 per cent over February 2020—the largest increase recorded across the Real Estate Board of Greater Vancouver, including the Sunshine Coast and Whistler; however, Bowen is the only municipality which has shown a flattening/decrease in Average Sale Price since December 2021.
This is largely attributable to low inventory. Historically, monthly inventory levels are at their lowest at the end of January and rebound in February; this year they have continued to decline, matching the 10 year low recorded in January 2018. Some homeowners, wanting to downsize, are waiting for smaller homes to be listed before they list their own. The under $1.5 million category, typically responsible for over 75 per cent of annual sales, has only 5 properties listed at this writing. Some, reluctant to list due to the perceived risks of COVID transmission have been waiting for the vaccination program.
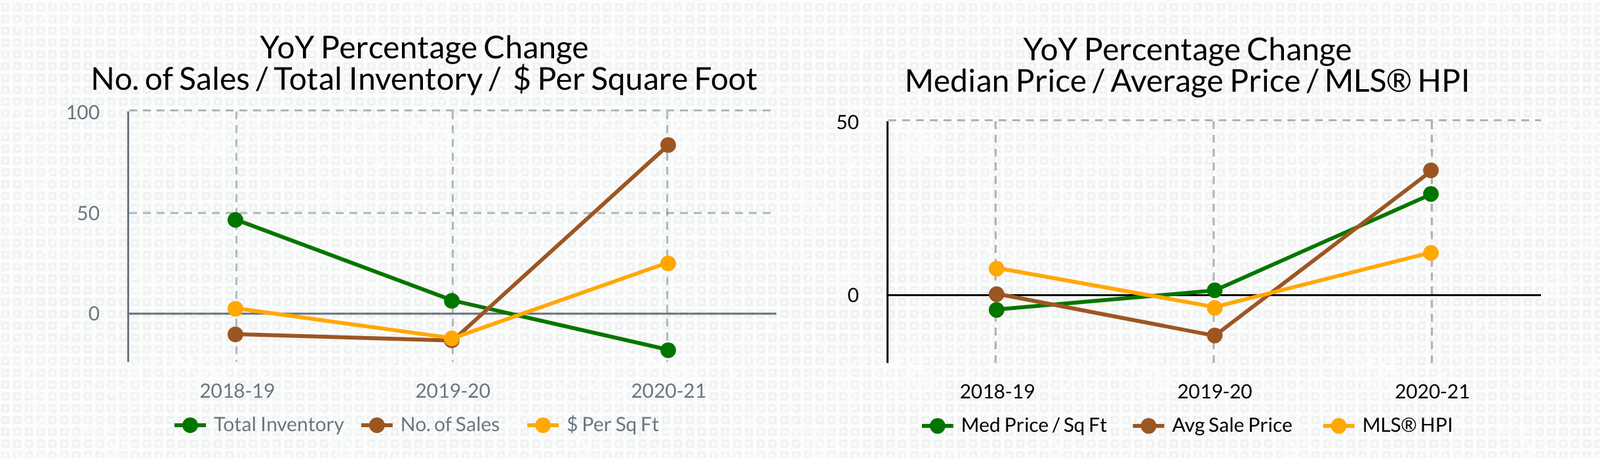
With the exception of low inventory, all but two YoY indicators were at or near record highs. MLS® Home Price Index, Median and Average Sold Price, Median Price per Square Foot, and Annual Dollar Volume of Sales set new record highs. Average Price per Square Foot and Annual Number of Sales were the exceptions.
The economic outlook coming out of COVID will have an impact on real estate, especially if mortgage rates begin to creep up. On March 11, 2021, the Financial Post reported that Moody’s Senior Vice President David Beattie “does not anticipate a persistent move higher in long-term bond yields or mortgage rates. While rising yields indicate an improving economic outlook, the recovery is expected to remain “uneven and fragile,” he said in a note. ‘Will a 25-basis-point increase in the five-year rate dampen mortgage demand significantly? No,’ he told Reuters. ‘But a 100-basis-point increase would.’” https://financialpost.com/news/fp-street/higher-mortgage-rates-bring-cheer-to-canadian-banks-but-rapid-rise-could-end-housing-party
The seller’s market continues. Like other more rural areas, Bowen remains attractive to buyers, record high prices do not seem to be a barrier and, with Bowen’s low inventory market, there is increased competition for desirable properties.
* YoY: Year-over-Year represents the previous 12 months of activity.
MONTH OF FEBRUARY DETACHED HOMES
SALE PRICE vs LIST PRICE
Low $ 675,000 $ 699,000
High $1,662,000 $1,499,000
• Average Sale: $1,174,666
• Median Sale: $1,183,000
YoY INDICATORS
• MLS®HPI: $1,073,667
• Average Price: $1,376,303
• Median Price: $1,212,000
YoY LOTS AVERAGE SALE PRICE
$15.73 per sq. ft.
STATS ON BOWEN is an analysis of detached homes activity on Bowen Island
Published mid-month of the month following.
If you would like STATS ON BOWEN sent to your inbox,
you can SUBSCRIBE HERE free of charge.
WE DO NOT SPAM.
You will only receive email related to the STATS ON BOWEN monthly reports.