Third quarter sales lowest since 2012
The third quarter of 2021, July through September, registered the least number of sales since 2012, with only one-third compared to Q3 2020 and less than half compared to Q3 2019. Inventory in the first three quarters of 2021was the lowest in 10 years for Q1-Q3. At the same time the MLS® Home Price Index, Average Sale Price, and Median Sale Price was up month-over-month and year-over-year for all three quarters of 2021, underscoring the relationship between low inventory and upward pressure on prices.
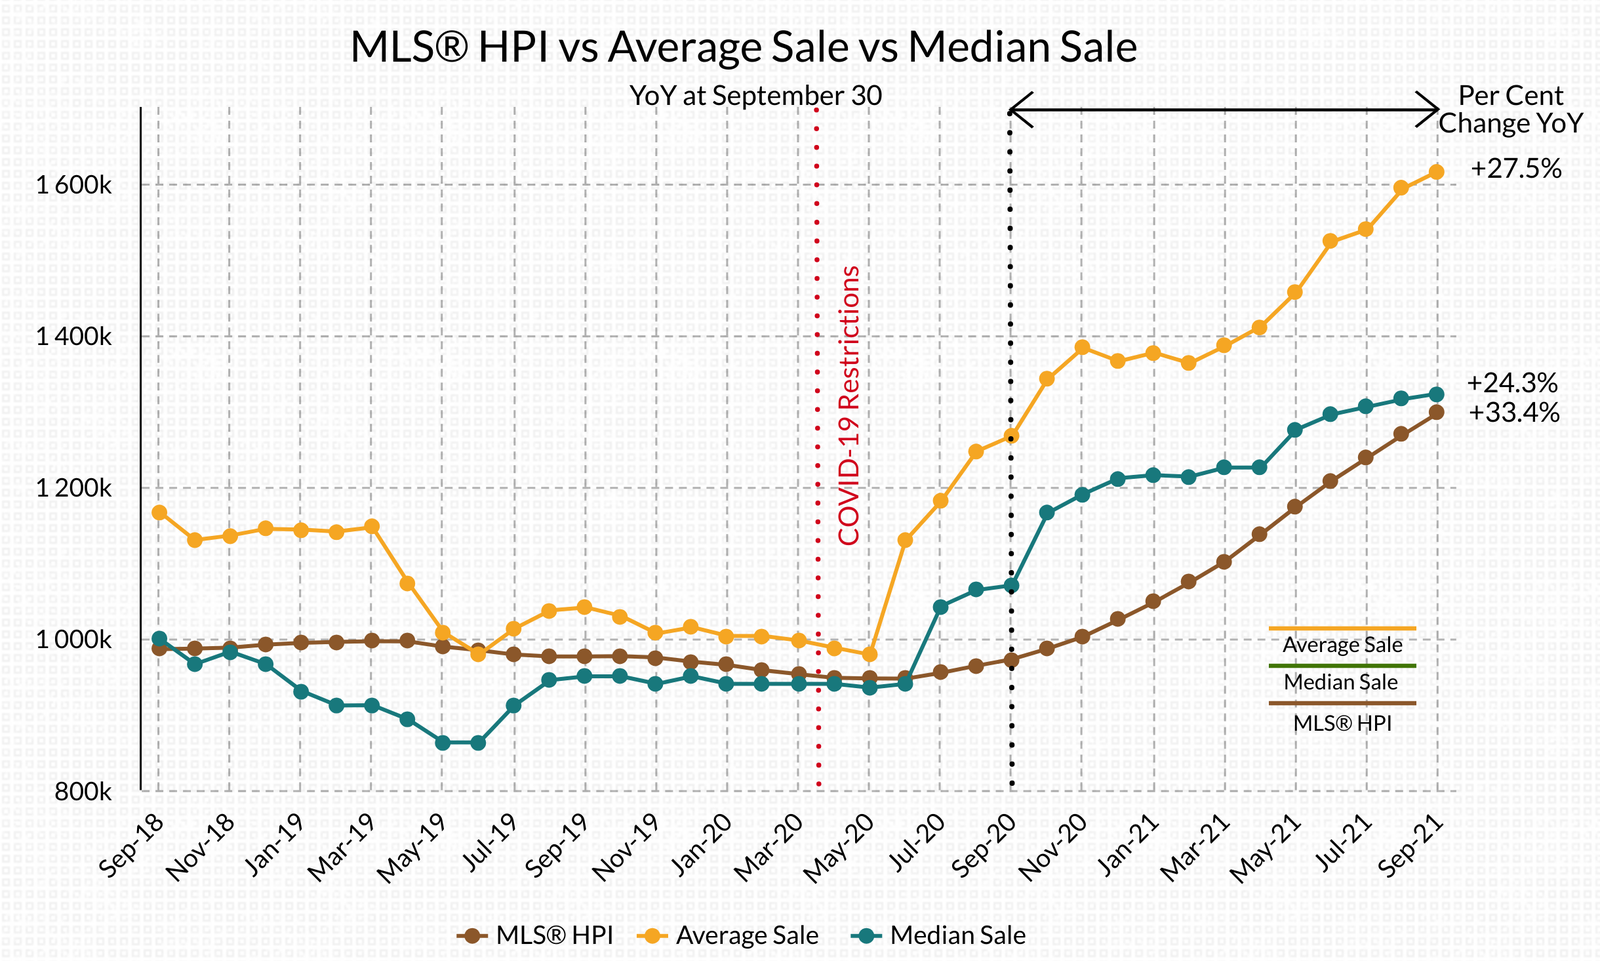
Although the MLS® HPI, Average Sale Price, and Median Sale Price have continued to increase—up YoY by 32.2, 27.5, and 24.3 per cent respectively—rising prices have not encouraged listings.
Because of Bowen’s long history encouraging large lot single family developments, for those wishing to downsize on Bowen there is little diversity in housing styles, such as homes with single floor living, attached homes (duplexes and row houses), homes with attached or detached suites for caregivers, mortgage helpers, or extended family, or even secure tenure rental accommodation. As a result, property owners are choosing to remain in their homes rather than leave the island.
For buyers, the YoY benchmark price on Bowen continued to rise, reaching $1.297 million in September 2021. Once known as one of the more affordable options in the lower mainland, Bowen Island’s YoY benchmark price has risen from the lowest 20 per cent to the median price for Metro Vancouver.
Year-over-year, in 2019, fifty-four per cent of homes sold for less than $1.0 million; in 2020, 38 per cent sold for less than$1.0 million; and in 2021, 20 per cent sold for less than $1.0 million. The lowest price paid for a home in September this year was $1.212 million and the highest paid was $1.764 million. On October 15, 2021, there were 18 active detached home listings on Bowen. The lowest listed price was $1.299 million. The highest was an outlier, $17.588 million, and the next highest was $4.840 million.
Expect more of the same through the last quarter of 2021. Low inventory will keep pressure on prices although increases will moderate.
Month of September Detached Homes
SALE PRICE vs LIST PRICE
Low $1,211,900 $1,075,000
High $1,764,000 $1.898,000
Average Sale: $1,374,980
Median Sale: $1,305,000
YoY INDICATORS
MLS®HPI: $1,297,192
Average Price: $1,615,543
Median Price: $1,322,500
STATS ON BOWEN is an analysis of the detached home market activity on Bowen Island.
Published during the month following.
If you would like STATS ON BOWEN sent to your inbox,
you can SUBSCRIBE HERE free of charge.
WE DO NOT SPAM.
You will only receive email related to the STATS ON BOWEN monthly reports and the occasional update.