Market continues to moderate as inventory remains low
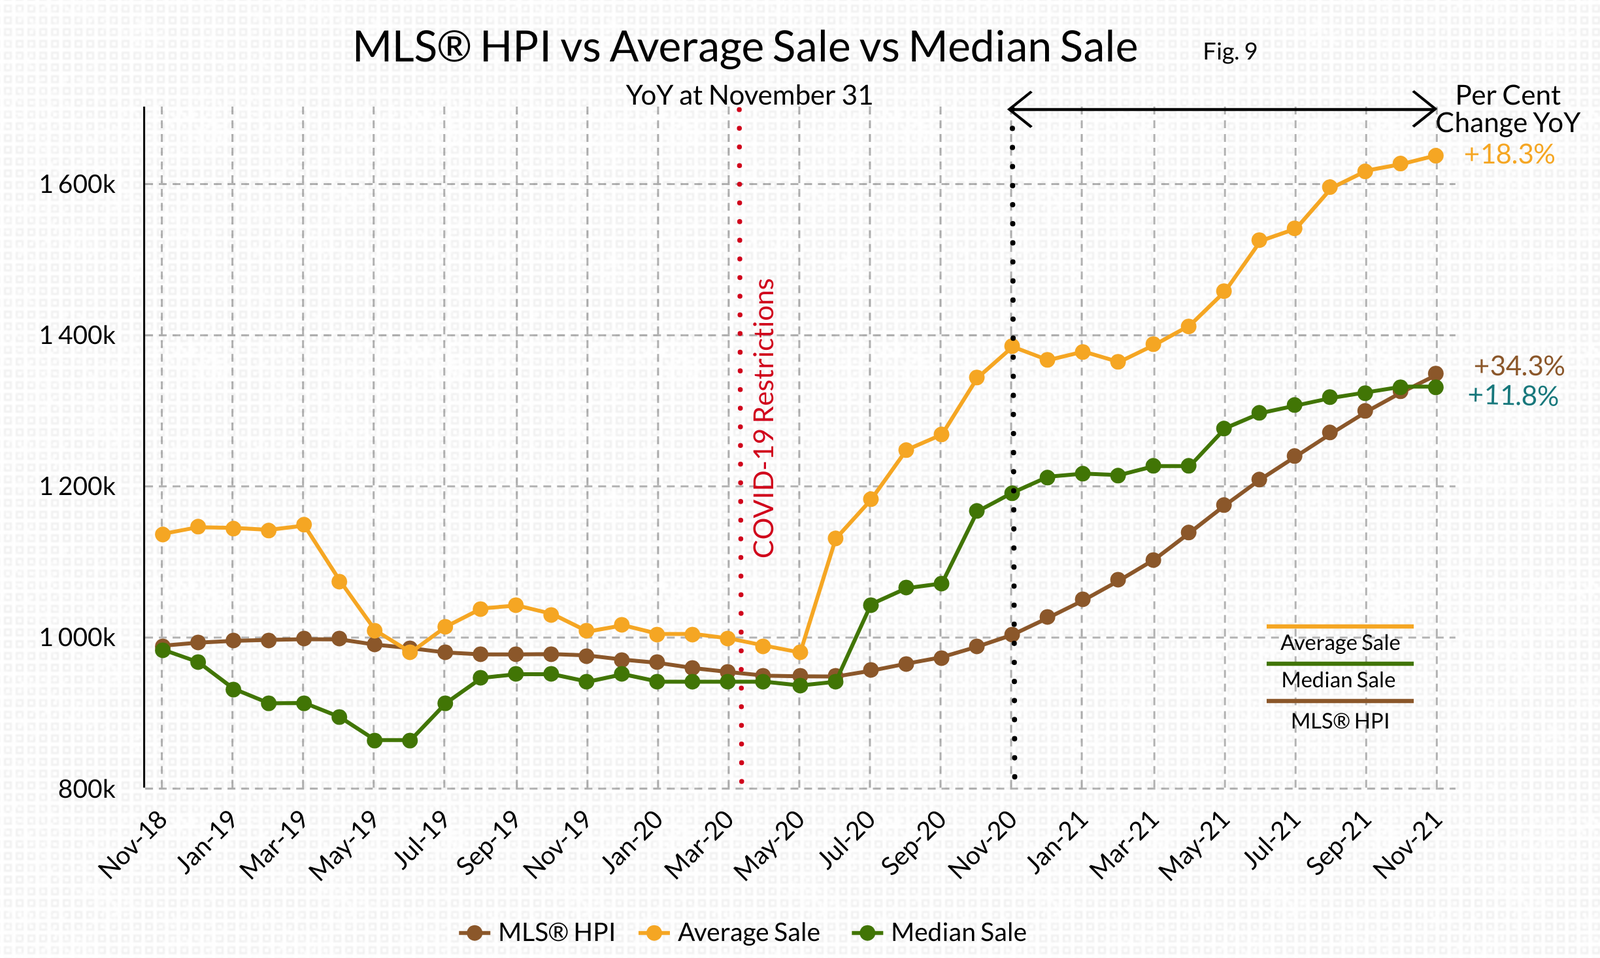
Average Sale, Median Sale, and MLS® Home Price Index (or benchmark price) were all up YoY in November; however, the growth curve flattened for all three metrics. The change from October ’21 to November ‘21 was modest at 0.7 per cent for Average Sale, 0.0 per cent for Median Sale Price, and -1.5 per cent for MLS® HPI.
Bowen Island continued to lead Metro Vancouver municipalities with a 34.3 per cent increase YoY for the benchmark price. The Sale Price per Square Foot increased only 0.5 per cent YoY. Sale price per square foot can be a very misleading statistic on Bowen Island, as it is based on the price paid for the property divided by square foot size of the home. This works well in urban areas where the size of the home and the size of the lot tend to be more similar; however, on Bowen lot sizes can range from 10,000 sq. ft. to 10 acres.
Year over year in November, the number of sales under $1.0 million fell by -43.5 per cent and $1.0 million to $1.5 million fell by -16.2 per cent. Sales in the $1.5 million to $3.0 million increased by 37.5 per cent.
Bowen developers brought new lots to market in 2021. Year-over-year sales of lots increased 68.8 per cent and dollar volume of sales increased 45.6 per cent.
Low inventory on Bowen Island will continue to keep pressure on prices but with only minor increases over the winter.
Hazardous Areas Development Permit Area
The municipality is proposing a Hazardous Areas Development Permit Area [HADPA] bylaw, which has been a long time coming.
The proposed bylaw is not only a required of municipalities but is in the public’s best interest. Should a property be designated as falling within an HADPA, the impact on the value of the property and/or the ability to insure against risks could be significant.
This link is to a map the municipality has produced to identify properties which may fall within the HADPA, with a disclaimer stating that this map may not identify all areas affected. Some properties appear to be very significantly affected.
If you are considering making improvements, selling, or buying property, you should check the map for the property location to determine if it is identified as being in an HADPA. If the property is identified, you may want to consult the municipality about the impact it may have and any mitigations available to you.
Month of November Detached Homes
SALE PRICE vs LIST PRICE
Low $1,240,000 $1,299,000
High $2,525,000 $2,998000
Average Sale: $1,890,750
Median Sale: $1,899,000
YoY INDICATORS
MLS®HPI: $1,346,125
Average Price: $1,635,998
Median Price: $1,330,000
YoY Lots Average Sale Price Range
$33.45–17.02 per sq. ft.
STATS ON BOWEN is an analysis of the detached home market activity on Bowen Island.
Published during the month following.
If you would like STATS ON BOWEN sent to your inbox,
you can SUBSCRIBE HERE free of charge.
WE DO NOT SPAM.
You will only receive email related to the STATS ON BOWEN monthly reports and the occasional update.