The past 18 months accounted for 56.1 per cent of the benchmark price increase during the last decade.
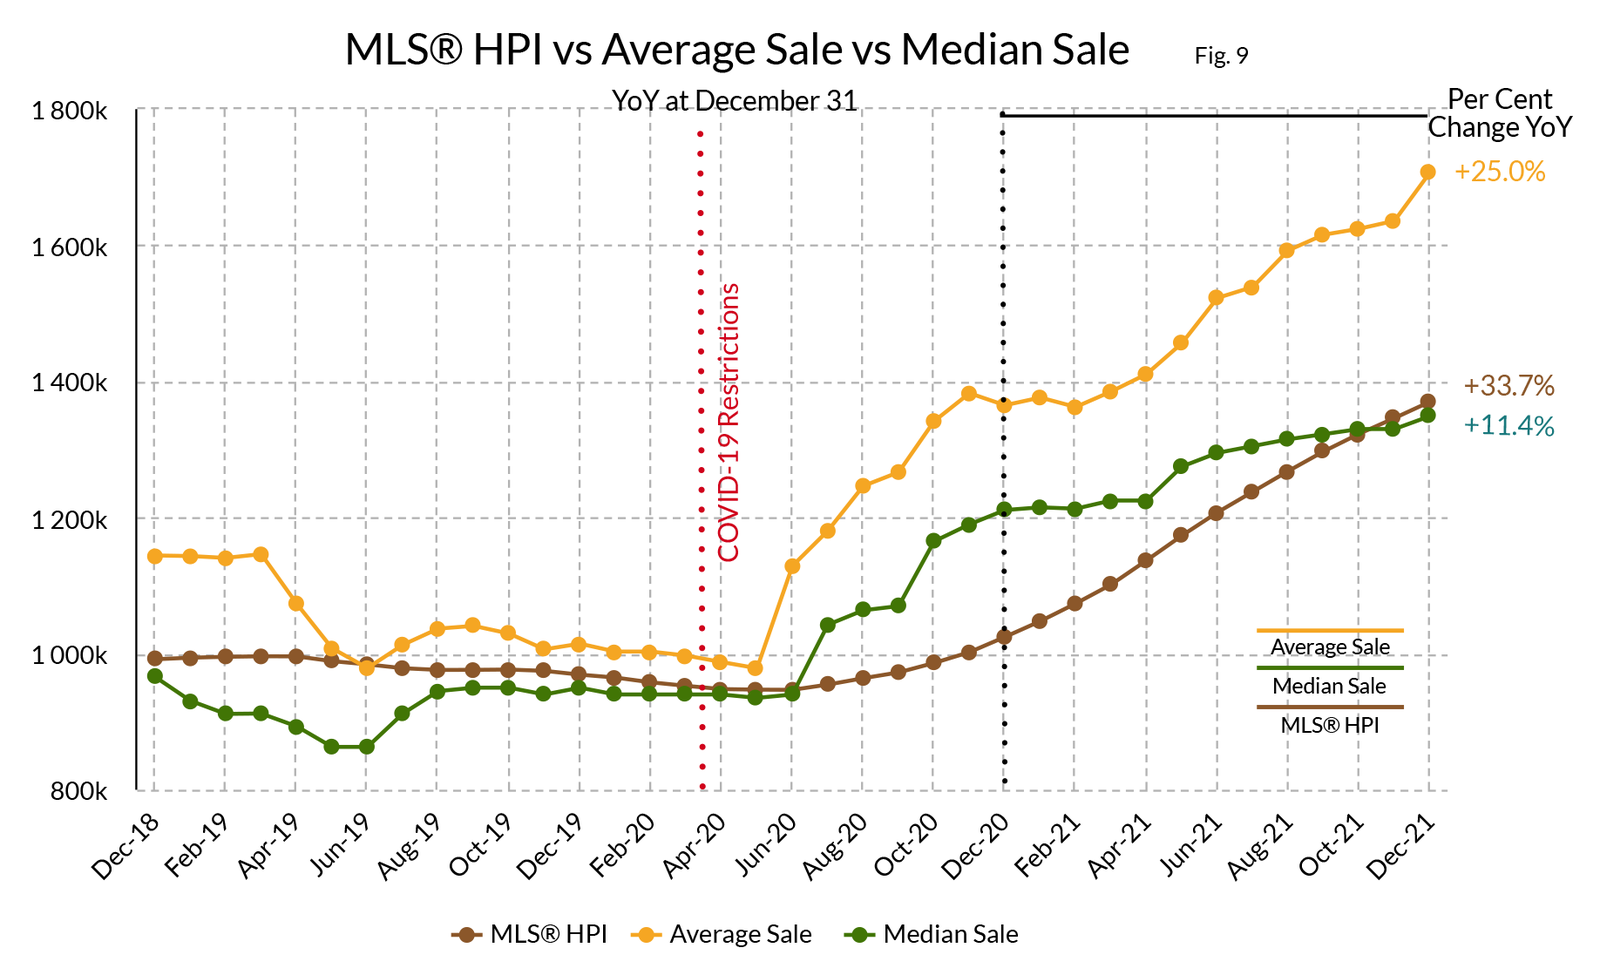
During the 12 months of 2021 on Bowen Island, the Average Sale Price increased 25.0 per cent, the Median Sale Price increased 11.4 per cent, and the MLS® HPI or benchmark price increased 33.7 per cent. Dollar Volume of Sales increased 8.1 per cent while the number of Sales decreased -13.6 per cent.
Over the 8 years from 1 July 2011 to 30 June 2020, the benchmark price increased 53.8 per cent and then increased another 4.7 per cent over the 18 months from 1 July 2020 through 31 December 2021. The past 18 months accounted for 56.1 per cent of the benchmark price increase during the last decade.
This rate of increase has moderated since the last half of 2020; however, the inventory level for detached homes in the month of December (8 properties) set a record low, and low inventory levels will continue to exert upward pressure on prices.
Bowen Island has led Metro Vancouver in YoY benchmark price increase since March of this year and compared to the REBGV (Real Estate Board of Greater Vancouver) which includes Whistler and the Sunshine Coast, the increase has been 33.7 and 19.6 per cent YoY respectively.
A total of 68 properties with detached residence were sold in 2021. The highest price paid for a property with a detached residence on Bowen Island was $13,600,000. The highest price paid for a detached residence on 5 acres or less was $5 million, and the lowest price paid was $675,000.
A total of 68 properties with detached residence were sold in 2021. The highest price paid for a property with a detached residence on Bowen Island was $13,600,000. The highest price paid for a detached residence on 5 acres or less was $5 million, and the lowest price paid was $675,000.
June 2021 set a record for the highest dollar volume of sales at $24,780,000, and July 2021 had the lowest dollar volume at $1,179,000.
Price point categories were also indication of change in Bowen Island inventory. In 2019, 56.6 per cent of homes sold were priced under $1.0 million and no homes priced over $1.5 million were sold. In 2021, 16.2% of homes sold were priced under $1.0 million, 44.1 per cent were priced between $1.0 and 1.5 million, and 39.7 per cent were priced over $1.5 million. During 2020 and 2021, comparing benchmark price for a detached home, Bowen Island moved from the lowest 20 per cent to the middle 15 per cent of Metro municipalities.
Bowen has lost its traditional reputation as one of the more affordable municipalities in Metro as it leads all municipalities in benchmark price increases and low inventory will keep the pressure on prices. The seller's market continues
Bad news for development in Snug Cove
Recent information from the Municipality that there is no capacity in the sewer treatment plant to accommodate existing unused connections or new connections to the Snug Cove Sewer System will have a significant impact. It is essentially a moratorium on development in Snug Cove, which has for years been identified by Council as, if not the only, the most desirable place for rental and multi-family development.
Month of December Detached Homes
SALE PRICE vs LIST PRICE
Low $1,751,517 $1,575,000
High $1,751,517 $1,575,000
Average Sale: $1,751,517
Median Sale: $1,751,517
YoY INDICATORS
MLS®HPI: $1,370,075
Average Price: $1,706,805
Median Price: $1,349,000
YoY Lots Average Sale Price Range
$60.76–$16.84 per sq. ft.
STATS ON BOWEN is an analysis of the detached home market activity on Bowen Island.
Published during the month following.
If you would like STATS ON BOWEN sent to your inbox,
you can SUBSCRIBE HERE free of charge.
WE DO NOT SPAM.
You will only receive email related to the STATS ON BOWEN monthly reports and the occasional update.