Upward pressure on prices continues
There were no surprises in the January stats. The MLS® HPI (Home Price Index) or benchmark price YoY increased 33.1 per cent to almost $1.39 million, the Average Sale Price increased 27.1 per cent to $1.75 million, and the Median Sale Price increased 12.6 per cent to reach $1.37 million – all new records.
With YoY inventory down -48.4 per cent and new listings down -13.6 per cent, upward pressure on prices continued, although January new listings (6) were up from January 2020 (2) which may signal that more sellers are prepared to enter the market; however, several of these were previous listings brough back to the market. And the promise of mortgage rate increases has not inspired sellers to list while rates are low.
Buyers continue to look for Bowen real estate. Average Days on Market for a detached home was down -49.2 per cent YoY to 32 days, and a recent January transaction set a record for sold price of a detached home on a property less than one acre and not waterfront.
Price point categories were also indication of change in the Bowen buyer. During the 12 months leading up to January 2020, 61 per cent of homes sold for under $1.0 million compared to 28.9 percent YoY as of January 2021 and 12.9 per cent YoY as of January 2022. No homes priced over $1.5 million were sold YoY as of January 2020 compared to 22.9 per cent as of January 2021 and 44.3 per cent as of January 2022.
Bowen remained in a strong sellers' market position due to limited inventory and strong buyer interest in the Island.
Census Canada has begun publishing 2021 census statistics
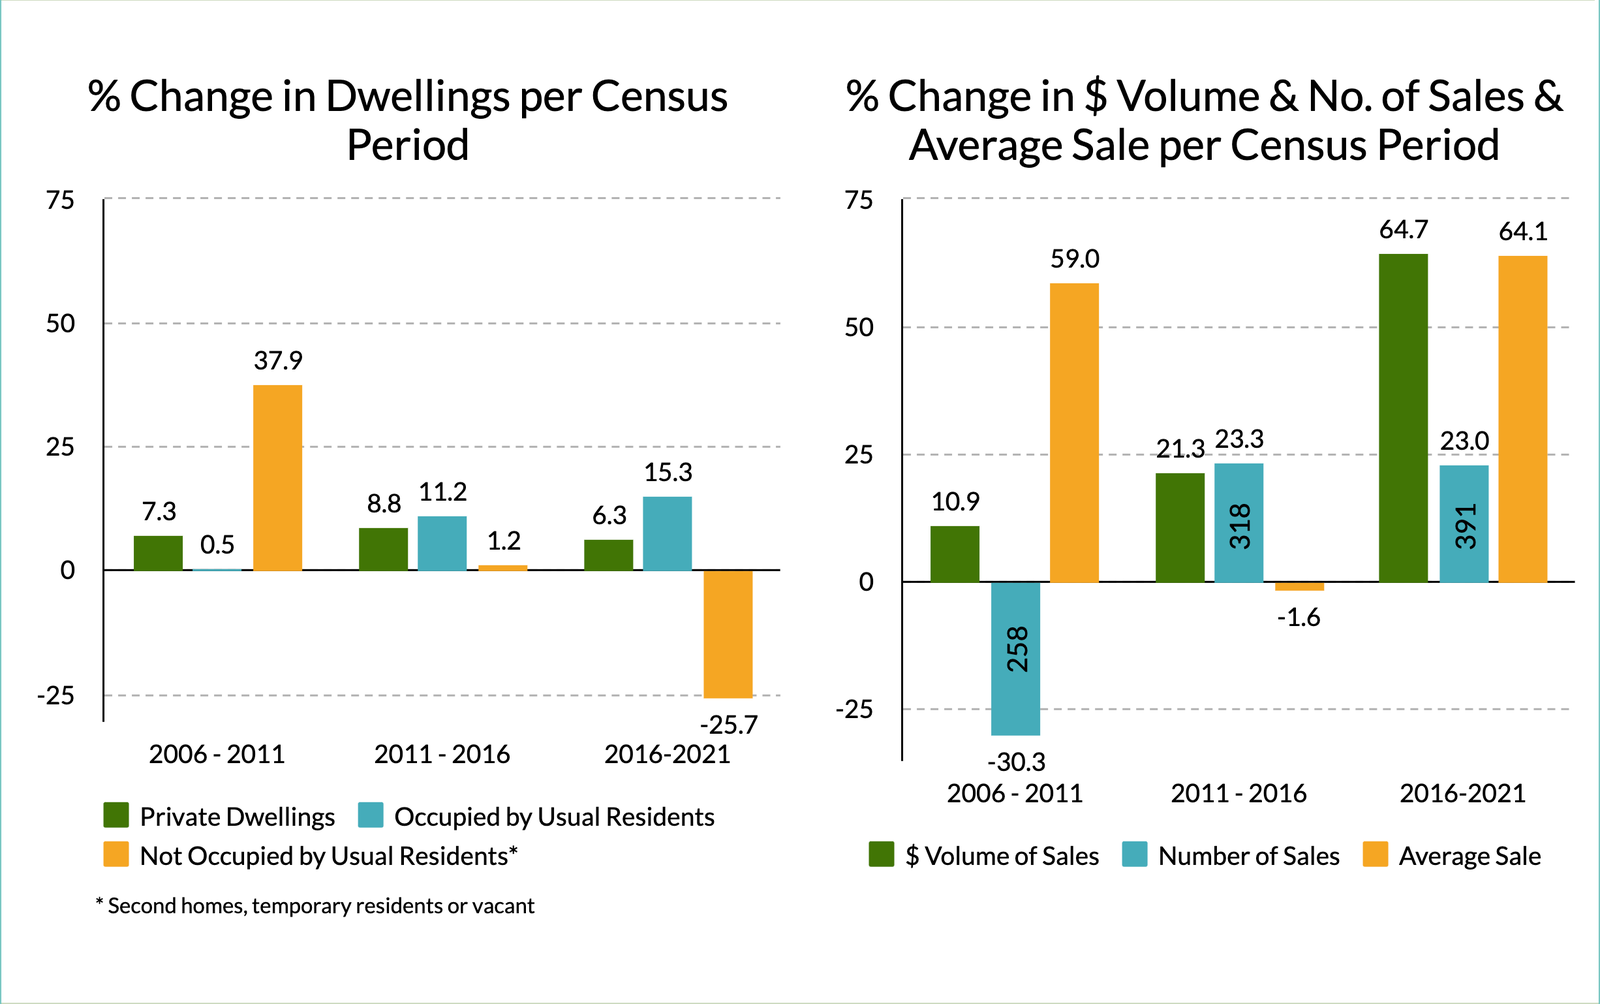
Census Canada has begun a slow release of the 2021 statistics. Information to date is limited, but it does provide some insight. The average number of persons per household remained constant at 2.5 over the last four censuses; however, the population increased by 15.7 per cent (576 people) over the past 5 years vs. 8.8 per cent during the 2016 census. This increase in population growth is in part attributable to COVID ‘refugees’ – folks moving to Bowen to escape denser urban neighbourhoods.
The largest change was in the number of Dwellings Not Occupied by Usual Residents (temporary residents like second homeowners, or vacant) which decreased by -25.7 per cent, indicating that there were significantly fewer homes not occupied by full time residents. Again, this is in part attributable to the impact of COVID during the last 2 years of the 2021 census period as some owners became year-round residents in their summer homes.
We will have to wait for additional releases to be determine what impact the past 5 years have had on the island demographics: who came and who left and what it might mean to the real estate market.
The average number of persons per household has remained constant at 2.5 for the last four census periods. This number can be used to provide a rough estimate of the number of people who left Bowen Island during the most recent census period.
- The population increased by 15.3 per cent or 576 units to 4256.
- The number of private dwellings increased by 6.3 per cent or 121 units to 2036.
- At 2.5 persons per household, the 121 new dwellings would accommodate 303 people.
- Private dwellings occupied by usual residents (full time on Bowen) increased by 15.3 per cent or 229 to 1724.
- At 2.5 persons per household, these 229 dwellings that became permanent residences would accommodate 573 people.
- The total number accommodated in new dwellings plus dwellings that became permanent residences during the census period is estimated at 876 people
- Eight hundred seventy six is 300 more than the 576 increase in population, which suggests that 300 people, or 60 people per year, left Bowen Island from mid-2016 to mid-2021.
STATS ON BOWEN is a detailed analysis published monthly once all data for the month has been reported.
Published during the month following.
If you would like early access to the report during the first week of the month,
you can SUBSCRIBE HERE free of charge.
WE DO NOT SPAM.
You will only receive email related to the STATS ON BOWEN monthly reports and the occasional update.
You will only receive email related to the STATS ON BOWEN monthly reports and the occasional update.