Bowen market registers first decline in the MLS® Average Sale Price in a year
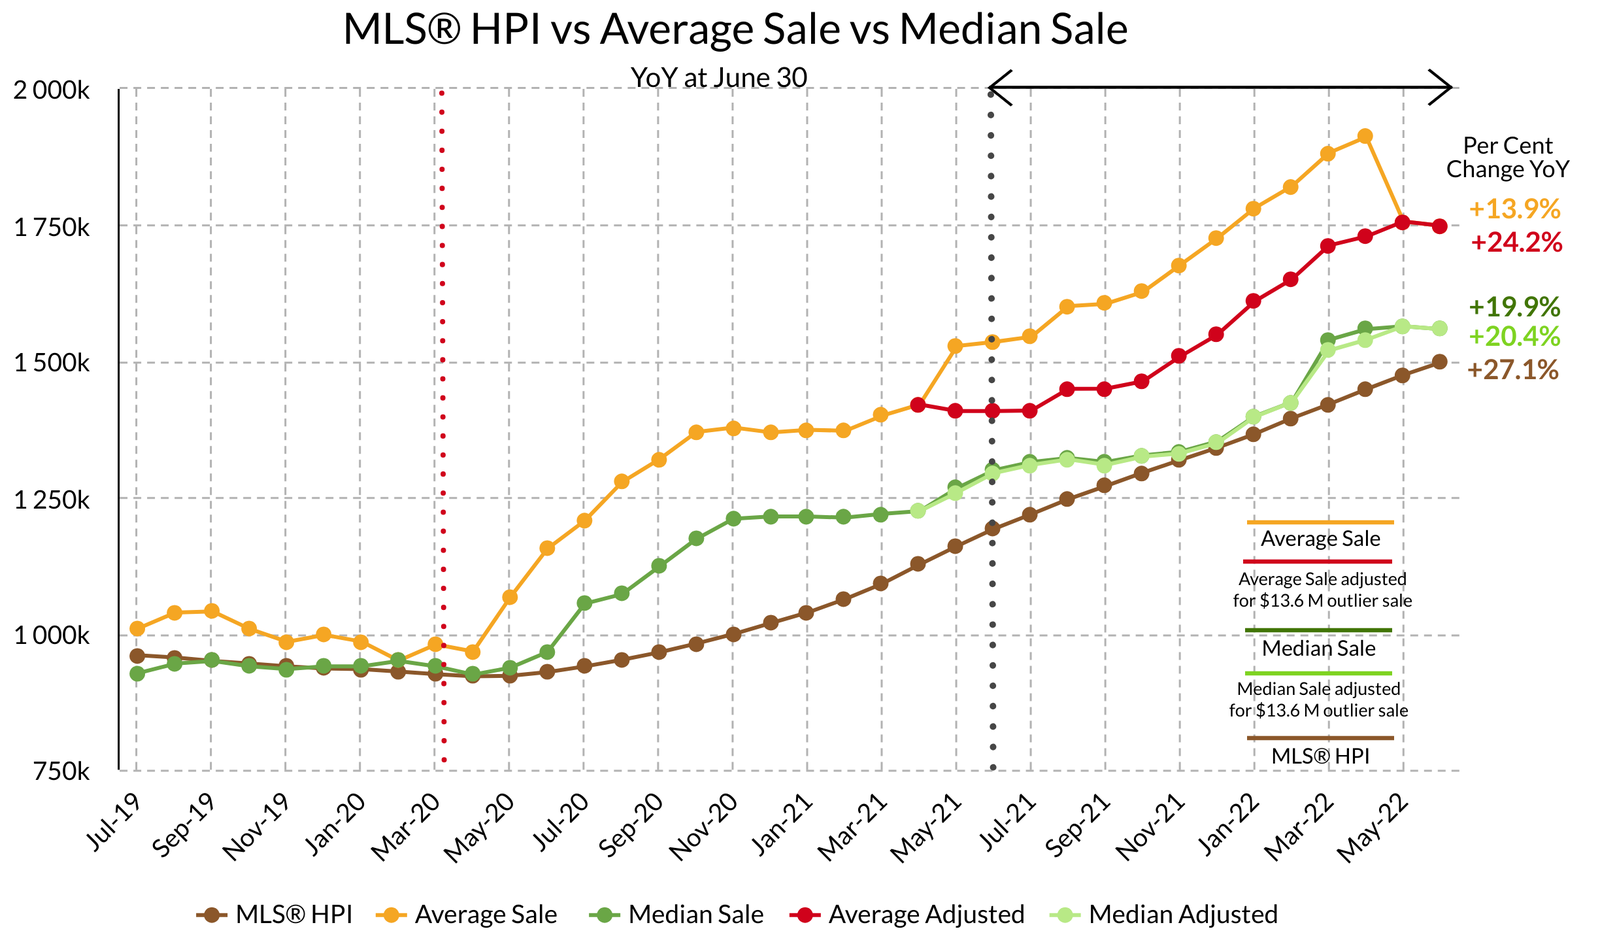
June 2022 saw the YoY Average Sale Price* down slightly at $1,749,019 or -0.43 per cent from the YoY record high in May 2022, notable because it is the first decline in a year. The YoY Average Sale Price increased 24.2 per cent over the last 12 months.
The YoY Median Sale Price* was also down in June, ending at $1,559,000 or 0.35 per cent form the record high in May 2022. This was only the second decrease in Median Sale Price in the last year. The YoY Median Sale price increased 20.4 per cent over the past year.
The YoY MLS® Home Price Index or benchmark price continued to move upward, ending June 2022 at record high of $1,497,900, up 1.56 per cent over May 2022, and up 27.1 per cent over the past year.
Year-over-year, detached properties sold for an average of 98.5 per cent of list; however, the gap between List Price and Sold Price month-over-month has trended down over the past year. The Average Sold Price in June 2021 was 101 per cent of list.
The Bank of Canada raised its rate 1.0 per cent on July 13th, putting it 2.25%above its rate in July 2021. “The Canadian economy is now clearly in excess demand, and inflation is high and broadening. The Bank is projecting inflation to decline to about 3% by the end of 2023, and to return to the 2% target by the end of 2024.” (bankofcanada.ca/2022/07/mpr-2022-07-13/)
The rate will be addressed again in September, October, and December, depending on the success of the current rate to curb inflation and avoid recession or the longer term pain of stagflation or recession-inflation, “a situation in which the inflation rate is high, the economic growth rate slows, and unemployment remains steadily high. It presents a dilemma for economic policy, since actions intended to lower inflation may exacerbate unemployment.” (en.wikipedia.org/wiki/Stagflation)
At this writing, MLS® shows 33 detached home properties listed on Bowen Island. Twenty-five per cent of these listings have seen price reductions from the original list price. The median price was $100,000, indicative of a slower
market more balanced market. Islanders can expect to see more price adjustments to current listings and to see less aggressive pricing on new listings.
market more balanced market. Islanders can expect to see more price adjustments to current listings and to see less aggressive pricing on new listings.
Bowen is shifting to a more balanced market where buyers will have more latitude to negotiate; however, as interest rates will reduce their buying power will be reduced.
We have seen the end of 2% increases in the benchmark price every month and price reductions on current listings are likely; however, we could still see a 1.0 – 2.0 per cent YoY increase in the benchmark price for Bowen Island over
the year.
the year.
*Average and Median Sale numbers used in this article have been adjusted to account for a $13,600,000 sale in May of 2021which is being treated as an outlier to give a more accurate picture of market shifts.
Month of JUNE Detached Homes
SALE PRICE vs LIST PRICE
• Low $759,000 $759,000
• High $2,375,000 $2,375,000
• Average Sale: $954,656
• Median Sale: $950,000
YoY INDICATORS
MLS®HPI: $1,497,900
• Average Price: $1,749,019
• Median Price: $1,550,000
YoY Lots Average Sale Price Range
$8.73–22.15 per sq. ft.
STATS ON BOWEN is a detailed analysis published monthly once all data for the month has been reported.
Published during the month following.
If you would like early access to the report during the first week of the month,
you can SUBSCRIBE HERE free of charge.
WE DO NOT SPAM.
You will only receive email related to the STATS ON BOWEN monthly reports and the occasional update.