Blog post content goes hereAverage and Median Sale Price continues downward trend while Benchmark Price continues upward
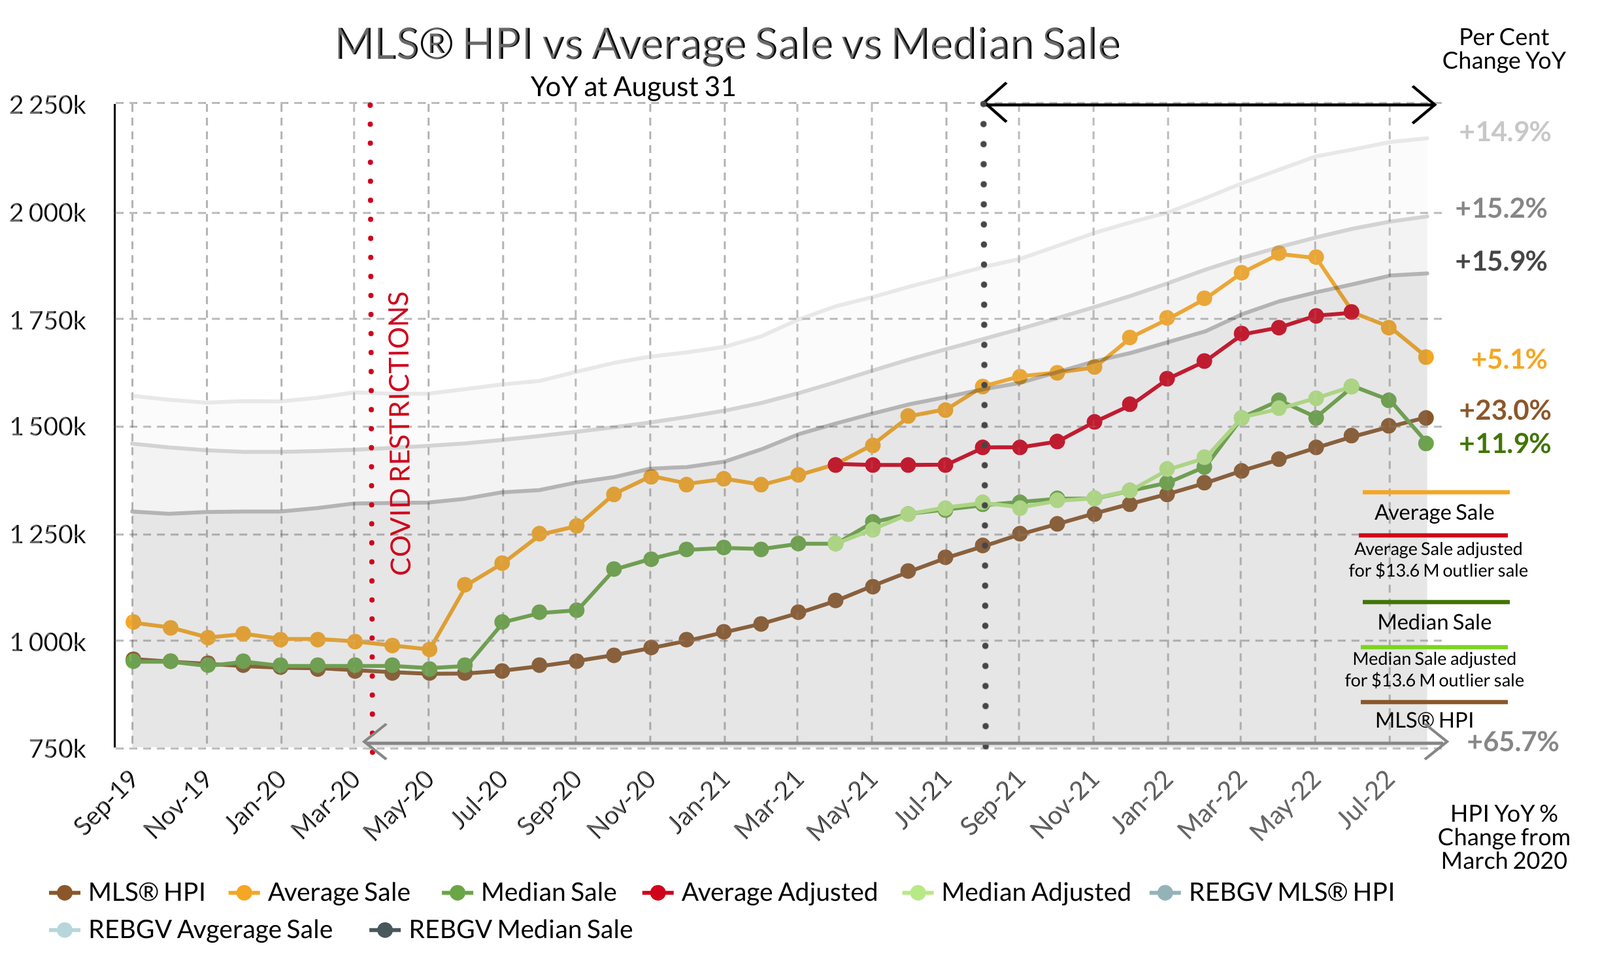
The decline in the Bowen Island YoY Average Sale Price and Median Sale Price over the past 4 months continued, registering a -1.5 per cent decline YoY for August and a -12.0 per cent decline YoY since April. The YoY MLS® Home Price Index or Benchmark Price, at 23.0 per cent continued its uninterrupted climb since June 2020, although YoY per cent change has been falling since January 2022.
Until January 2022, Bowen Island led Metro Vancouver municipalities in YoY MLS® Home Price Index or Benchmark Price. By July 2022, the YoY Benchmark Price for Bowen had risen to represent the median price for Metro and remained as the median for August.
While the YoY Benchmark Price rose slightly for most of Metro except Bowen Island, West Vancouver, Port Moody, Langley, Langley City, and Maple Ridge where the YoY Average Sale Price fell slightly.
Year-to-date the Dollar Volume of Sales in August was down only 0.15 per cent compared to YoY Dollar Volume of Sales which was down 9.76 per cent compared to the same period last year.
Downward pressure on the YoY Average and Median Sale Price suggests the Benchmark will plateau. In August 2022, the YoY Median Sale Price fell below the Benchmark Price by -4.8 per cent, signalling there may be enough pressure on 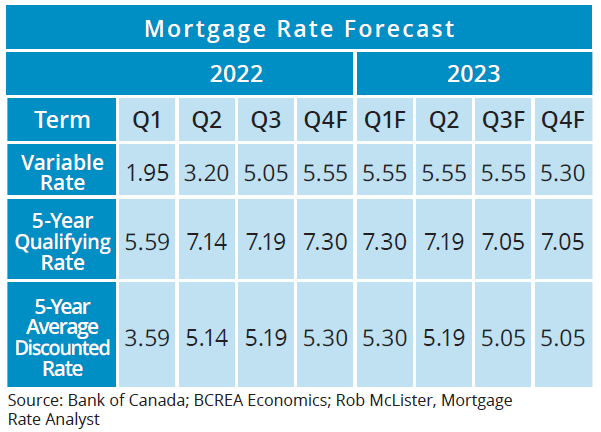 the Benchmark Price to see it fall over the next few months. In October 2018 the YoY Median Sale Price fell below the Benchmark Price by 0.70 per cent and stayed below the Benchmark through August 2019. At the end of those 11 months the Benchmark Price had fallen -1.7 per cent before recovering 60.0 per cent over the next 3 years to 31 August 2022.
the Benchmark Price to see it fall over the next few months. In October 2018 the YoY Median Sale Price fell below the Benchmark Price by 0.70 per cent and stayed below the Benchmark through August 2019. At the end of those 11 months the Benchmark Price had fallen -1.7 per cent before recovering 60.0 per cent over the next 3 years to 31 August 2022.The BCREA Mortgage Rate Forecast published 22 September 2022 predicts the 5-year Qualifying Average Discounted Rate to reach 5.30 per cent by the end of 2022 and end 2023, one-quarter of a per cent lower at 5.05. (Qualifying rate is 2 per cent higher.) This will erode the buying power of purchasers and will continue to contribute to lowering the average and the media sale price.
Activity has slowed to a more normal pace and Bowen is now solidly in a balanced market.
Month of AUGUST Detached Homes
SALE PRICE vs LIST PRICE
• Low $490,000 $499,000
• High $1,385,000 $1,385,000
• Average Sale: $885.833
• Median Sale: $860,000
• YoY INDICATORS
• MLS®HPI: $1,519,942
• Average Price: $1,701,889
• Median Price: $1,520,000
YoY Lots Average Sale Price Range
$6.65–44.44 per sq. ft.
STATS ON BOWEN is a detailed analysis published monthly once all data for the month has been reported.
Published during the month following.
If you would like early access to the report during the first week of the month,
you can SUBSCRIBE HERE free of charge.
WE DO NOT SPAM.
You will only receive email related to the STATS ON BOWEN monthly reports and the occasional update.