In October the MLS® HPI registered the first YoY decline since April 2020. Although just a 0.03 per cent decline over September 2022, The HPI is beginning to react to downward pressure by buyers as the Bank of Canada increased its rate by 0.25, 0.50, 0.50, 1.00, 0.75, and 0.50 in March, April, June, July, September, and October respectively. Currently at 3.75 per cent, the Bank of Canada has the highest rate among the G& countries, and with another rate announcement due December 7th, market consensus is that the rate will peak at $.25 per cent in December or early 2023.
The YoY Average Sold Price in October was $1,350,000, -4.4 per cent or $62,700 below the List Price. The YoY Average Sold Price for the past year was -2.6 per cent below list, for the last 5 years was -3.1 per cent below list, and for 2019 was -6.2% below list. From March 1st to October 31, 2020, the average sold price was -3.4 per cent below list.
There were 3 sales of detached homes in October. The highest price paid was $1.575 MM, -3.1 per cent below list and the lowest price paid was $1.078 MM, -7.2 per cent below list. Forty-seven homes have been sold since the Bank of Canada began rising the rate. The highest price paid was $3.030 MM, the lowest was $490,000, and the average price paid was $1,660 MM.
Sellers can expect to see continued downward pressure as buyers react to uncertainty about inflation and interest rates. Rates are not anticipated to move down any time soon. Market consensus suggests it could be a year before buyers see any softening in the rate.
Month of October Detached Homes
SALE PRICE vs LIST PRICE
• Low $1,000,000 $1,078,000
• High $1,575,000 $1,625,000
• Average Sale: $1,360,000
• Median Sale: $1,432,000
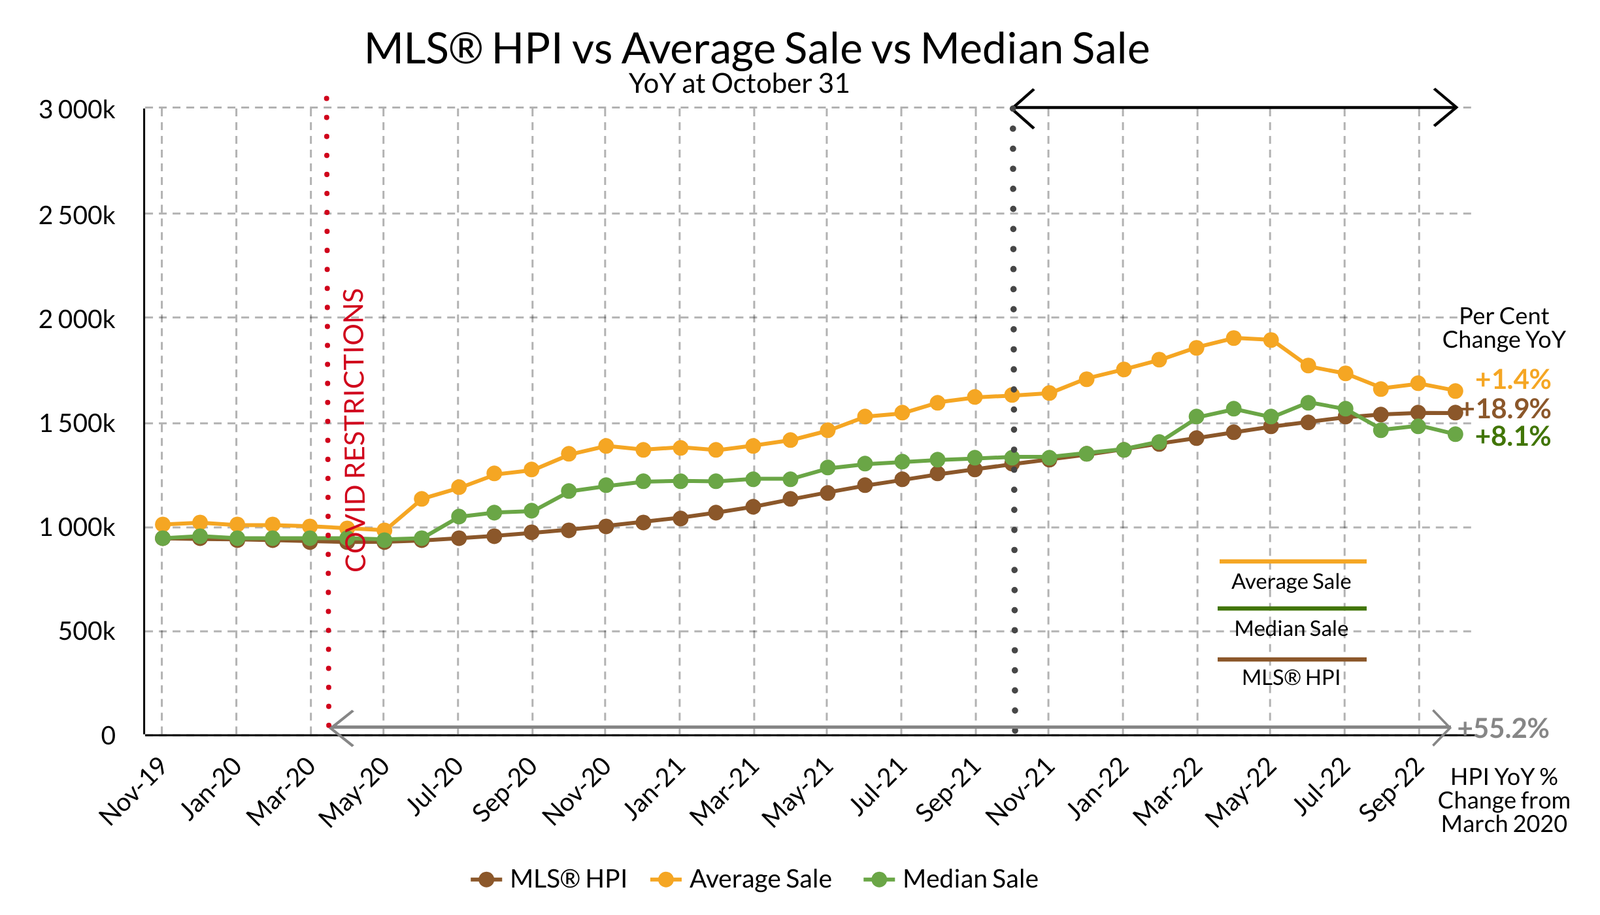
YoY INDICATORS
• MLS®HPI: $1,540,167
• Average Price: $1,647,086
• Median Price: $1,437,500
YoY Lots Average Sale Price Range
$8.31–27.81 per sq. ft.
STATS ON BOWEN is a detailed analysis published monthly once all data for the month has been reported.
Published during the month following.
If you would like early access to the report during the first week of the month,
you can SUBSCRIBE HERE free of charge.
WE DO NOT SPAM.
You will only receive email related to the STATS ON BOWEN monthly reports and the occasional update.