One year since Bank of Canada raise to 4.50%
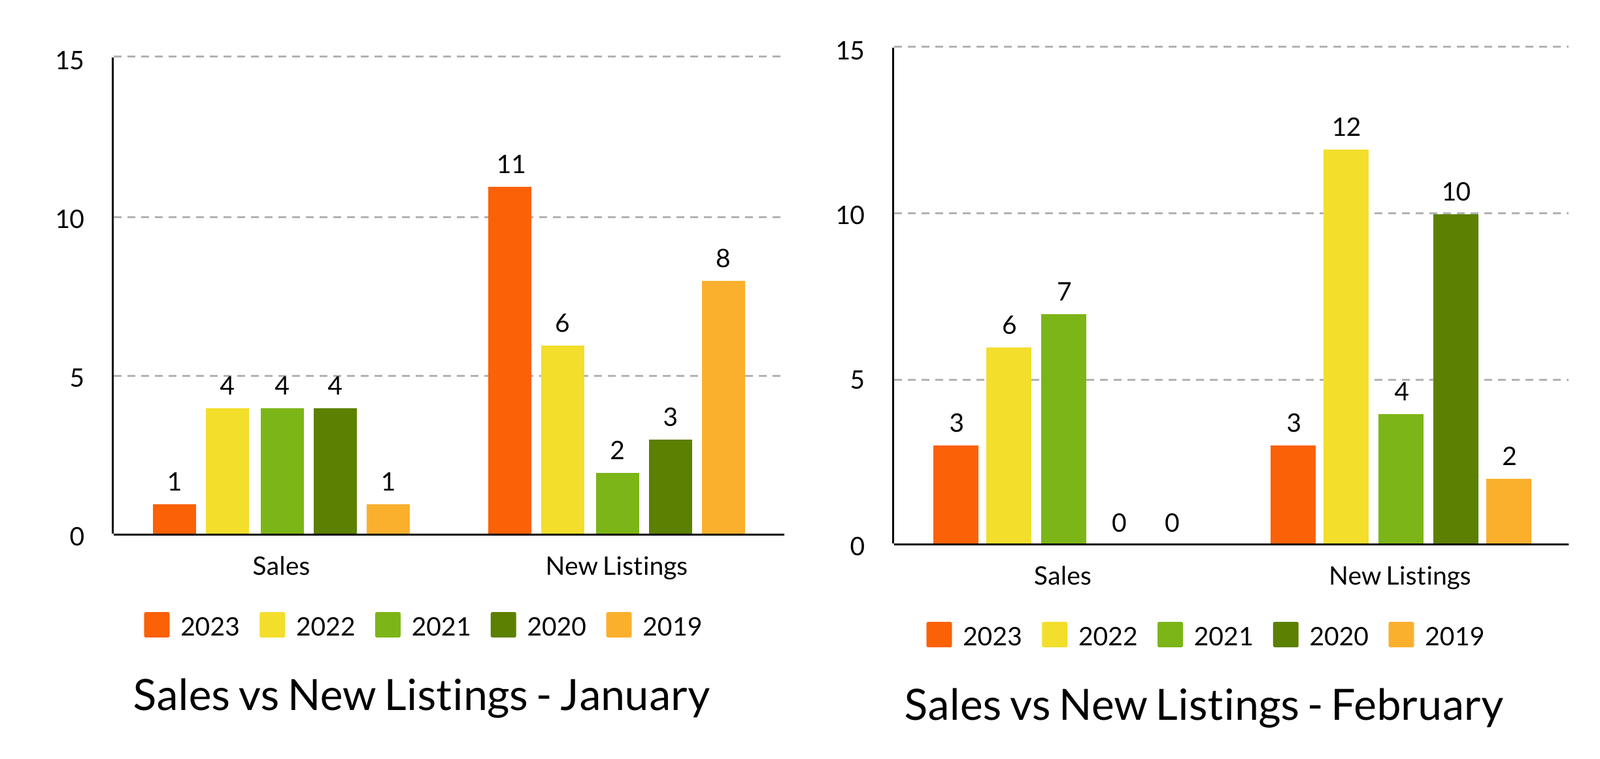
March 8, 2023, marked one year since the Bank of Canada began raising interest rates from 0.25 to 4.50 in January 2023. There was no increase in March, and the impact of the tax increases has served to slow the Bowen market. From September 2022 through February 2023 there were 16 detached home properties sold. Only 2 of the sales were over $1.5 million and the highest sale was$1.675 million. While this is a dramatic change from a year ago when for the same period there were 33 sales – 10 over $2.0 million – it is not a dramatic change from 2019 (pre-COVID) which also registered 16 detached home sales.
The sales of 3 detached homes in February 2023 represents a 50.0 per cent decrease from the 6 detached sales recorded in February 2022. The benchmark price for detached properties is $1,512,775 which represents an 8.4 per cent increase from February 2022 and a -1.2 per cent decrease compared to January 2023.
January 2019 saw the MLS® Home Price Index or benchmark price decline from $985,433 to $921,817 or -6.5 per cent by April 2020. Then the COVID effect saw Bowen’s benchmark price rise 67.1 per cent, peaking in September 2022 at $1,540,567. Since September we have seen a gradual decline to $1,512,775 or -1.8 per cent at the end of February 2023.
The Average List Price of $1,182,000 was -0.3 per cent below the average BC Assessment. The Average Sold Price for the 4 sales in January and February ranged from 8.7 per cent above to -18.1 per cent below the Assessment and the Average Sale Price of$1,133,725 was -4.3 per cent below average of Assessments.
The Bowen market has returned to pre-COVID activity levels with number of sales in January and February closely resembling 2019. The market is strongest for properties under $1.5 million and half of the 19 detached homes currently sale have been listed or brought back to market since the beginning of 2023. Inventory is high which is typical for this time of year and the average listing has been on the market for 117 days; however, the market appears hungry for new inventory as property sales in January and February averaged 3 days on market with a high of 7 and a low of 1 day.
Prices will continue to be moderated by interest rates as we move into Spring and very modest growth is anticipated over the coming year.
* YoY represents 12 months of activity
Month of February Detached Homes
SALE PRICE VS LIST PRICE
Low $1,080,000 $1,195,000
High $1,360,000 $1,388,000
Average Sale: $1,178,333
Median Sale: $1,095,000
YoY INDICATORS
MLS®HPI: $1,512,775
Average Price: $1,557,126
Median Price: $1,389,000
YoY Lots Average Sale Price Range
No Sales
STATS ON BOWEN is a detailed analysis published monthly once all data for the month has been reported.
Published during the month following.
If you would like early access to the report during the first week of the month,
you can SUBSCRIBE HERE free of charge.
WE DO NOT SPAM.
You will only receive email related to the STATS ON BOWEN monthly reports and the occasional update.