Downward trend showing signs of slowing
Bowen was one of only 10 Metro municipalities where the MLS® HPI was up YoY, with Port Coquitlam up 0.1 per cent and Anmore up 8.9 per cent while Langley City was down -6.8 per cent YoY.
YoY 63.5 per cent of homes on Bowen sold under $1.5 million, putting pressure on the Home Price Index and contributing to its continued decline; however, April’s top sale was $3,625,000, setting for a record price for a non-waterfront home on Bowen Island.
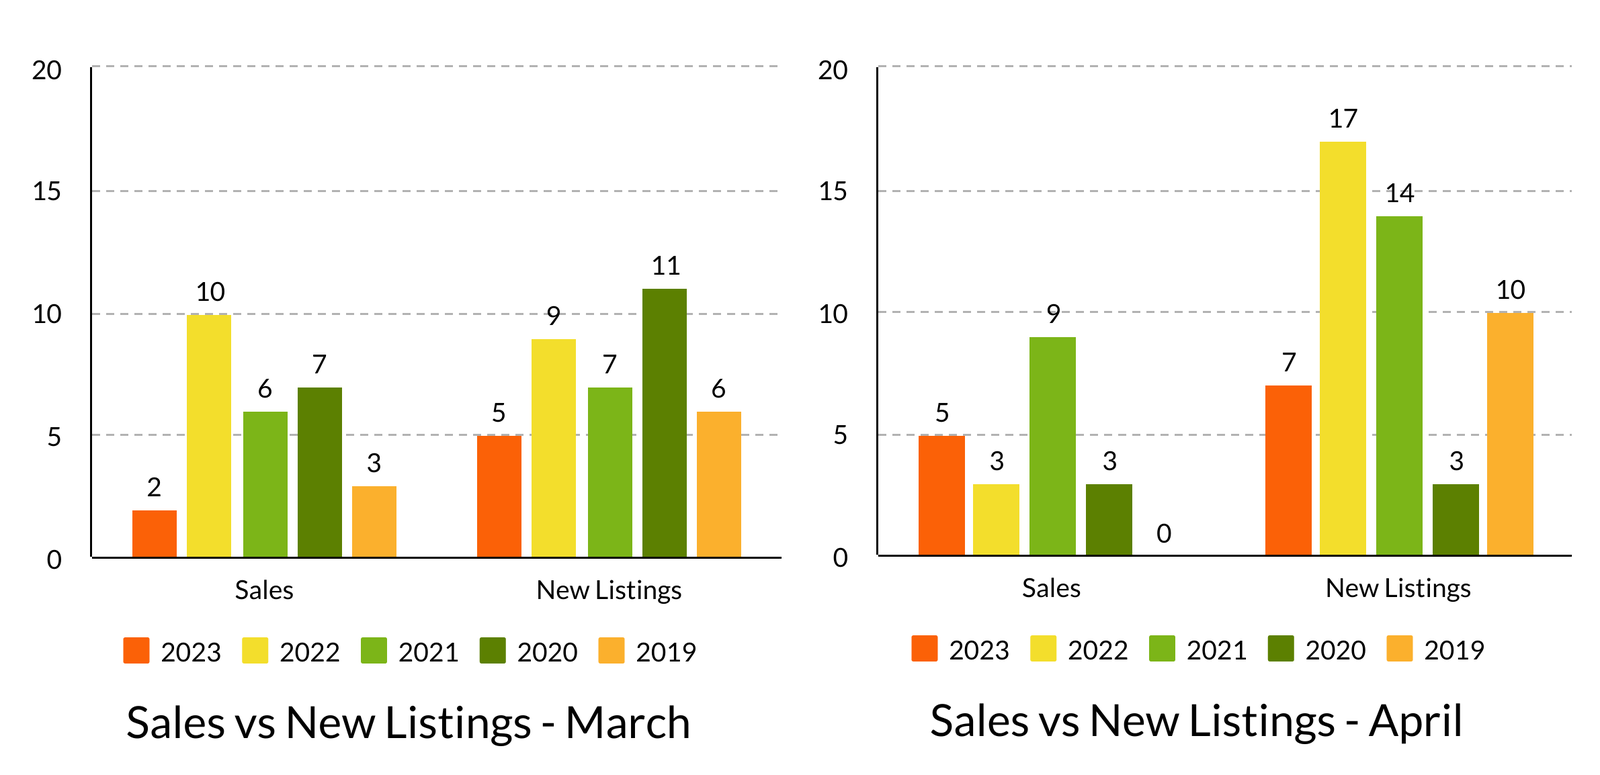
Sales are still sluggish, down -32.8 per cent YoY, although YtD properties under $1.2 million moved more quickly, with 5 sales happening within a week of listing. At this writing there are 21 residential detached properties and 28 lots on offer. New listings YtD were also slow, reflecting pre-COVID activity.
Relatively low inventory levels and high interest rates are tending to balance each other out and keep prices relatively stable, but although 30 per cent of sales YtD were above asking, the downward trend has yet to correct but is showing signs of slowing.
“While home sales remain close to 25 per cent below normal, the inventory of homes for sale has not accumulated significantly as potential sellers have held off on listing their homes in a down market. While significant uncertainty surrounds the economic outlook, the current market shows no signs of financial vulnerability or highly motivated sellers. As sales recover into a low inventory market, prices will likely begin to rise month-over-month and finish the year higher than at the start.” (https://www.bcrea.bc.ca/economics/housing-forecast/).This prediction is for all housing types (detached, attached, and condos) in BC.
Metro’s YoY MLS® HPI for detached homes decreased -8.8 per cent while Bowen’s increased 1.9 per cent. Metro’s YoY MLS® HPI was up 2.9 per cent April over March while Bowen’s decreased -1.2 per cent.
Metro’s YoY average sale price decreased -4.4 per cent while Bowen’s decreased -21.8 per cent. April over March, Metro’s average sale price increased 1.7 per cent while Bowen’s increased 4.1%.
Relatively low inventory levels and high interest rates are tending to balance each other out and keep price relatively stable, and although 30 per cent of sales YtD were above asking, the downward trend has yet to correct but is showing signs of slowing.
Month of April Detached Homes
SALE PRICE VS LIST PRICE
Low $865,000 $999,999
High $3,890,000 $3,625,000
Average Sale: $3
Median Sale: $1,818,599
YoY INDICATORS
MLS®HPI: $1,476,825
Average Price: $1,551,1061
Median Price: $1,384,000
YoY Lots Price Range
No Sales
STATS ON BOWEN is a detailed analysis published monthly once all data for the month has been reported.
Published during the month following.
If you would like early access to the report during the first week of the month,
you can SUBSCRIBE HERE free of charge.
WE DO NOT SPAM.
You will only receive email related to the STATS ON BOWEN monthly reports and the occasional update.