STATS ON BOWEN - May 2020
Posted on Jun 13, 2020
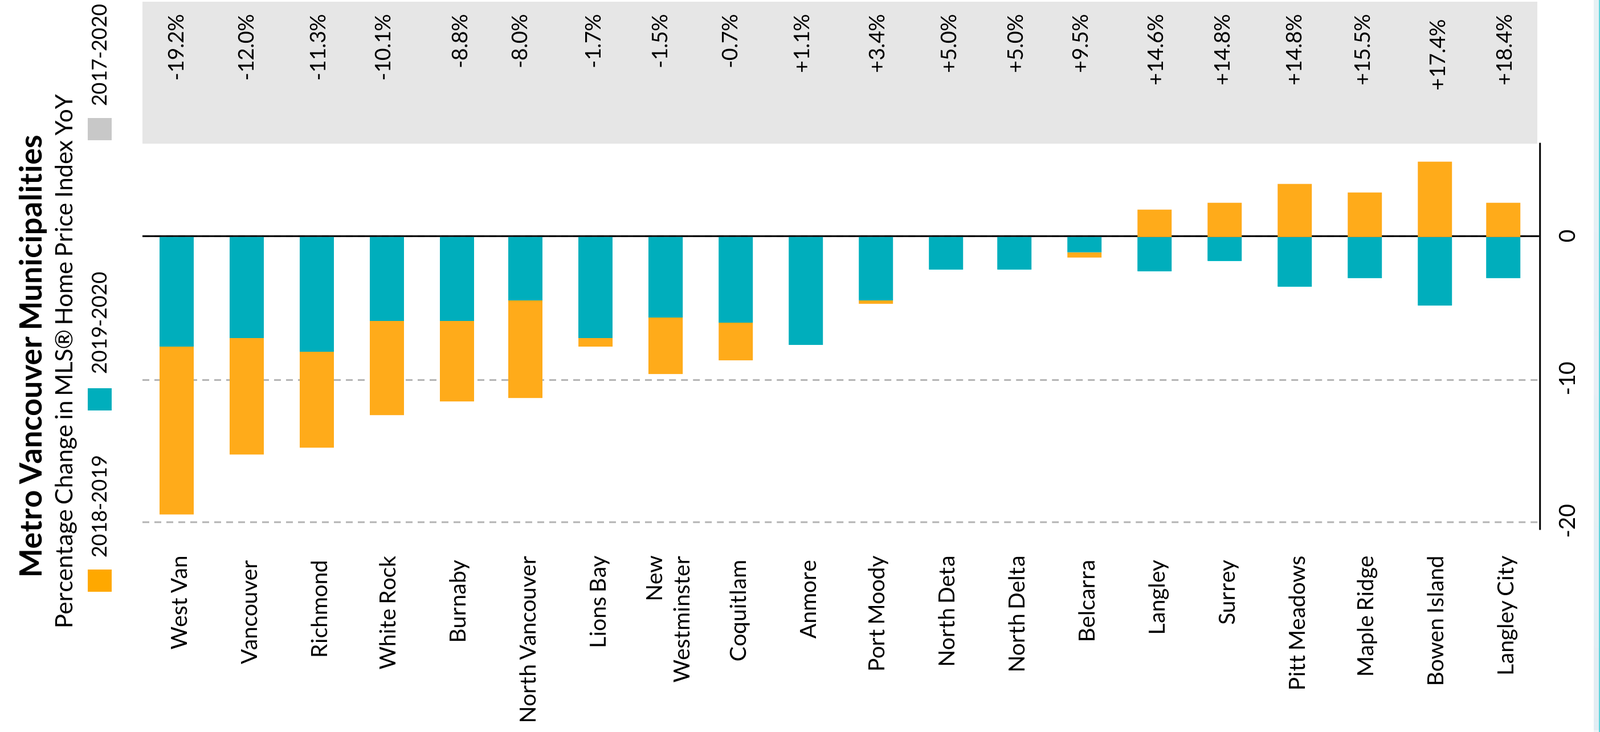
Home prices have remained firm in the early stages of this recession.
The COVID-19 pandemic has resulted in sudden and dramatic changes in every aspect of life, and as the curve flattens in BC, economists are addressing the que...
BCREA Report - COVID-19
Posted on Jun 10, 2020
The BC Real Estate Association report on the economy and the real estate market*:
While these are not normal times and there remains tremendous uncertainty, home prices have remained firm in the early stages of this recession. Without a sharp rise in inventory, the ultimate impact of dramatically slowing sales on home prices may be somewhat muted. T...
STATS ON BOWEN - April 2020
Posted on May 16, 2020
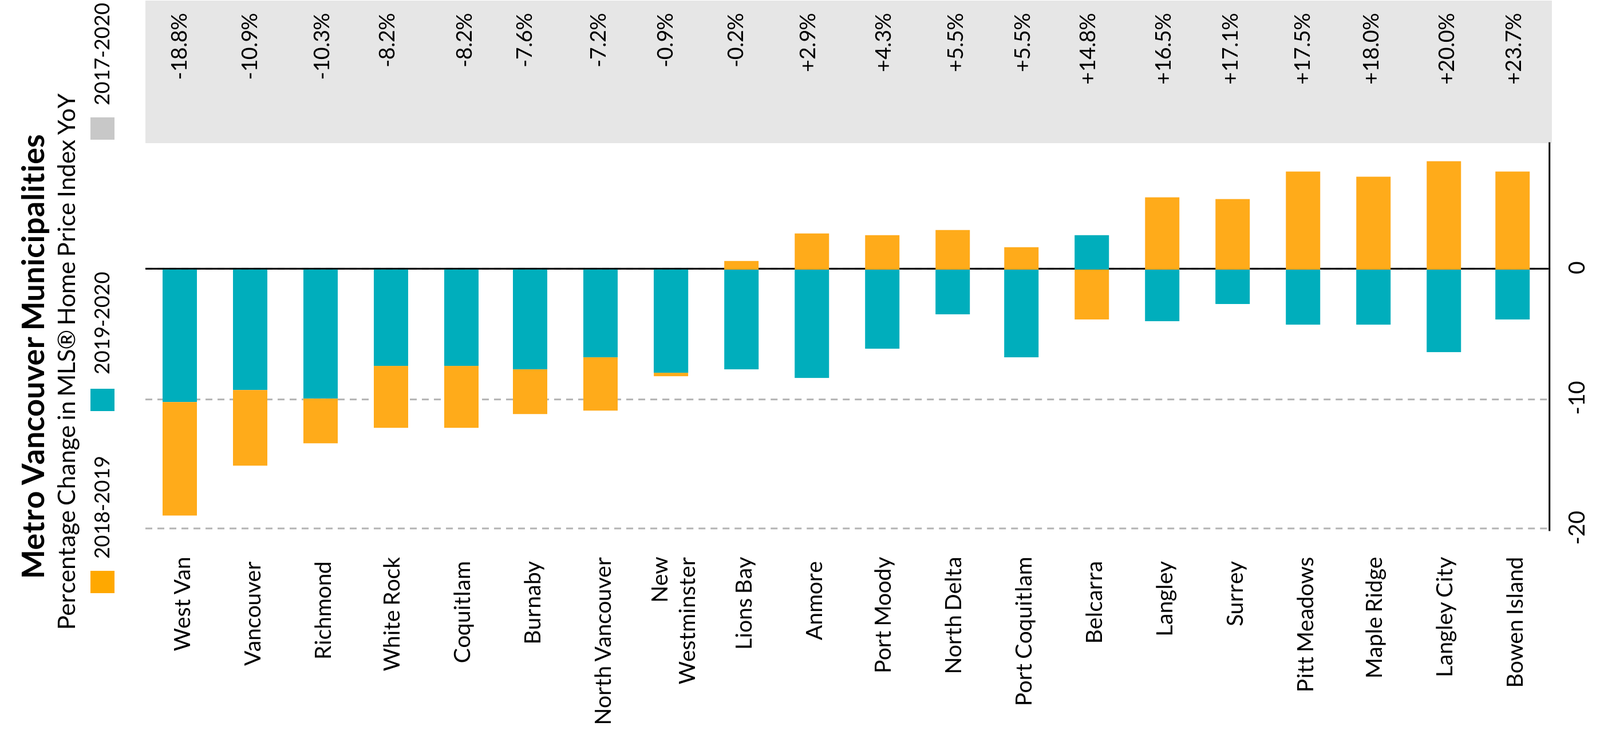
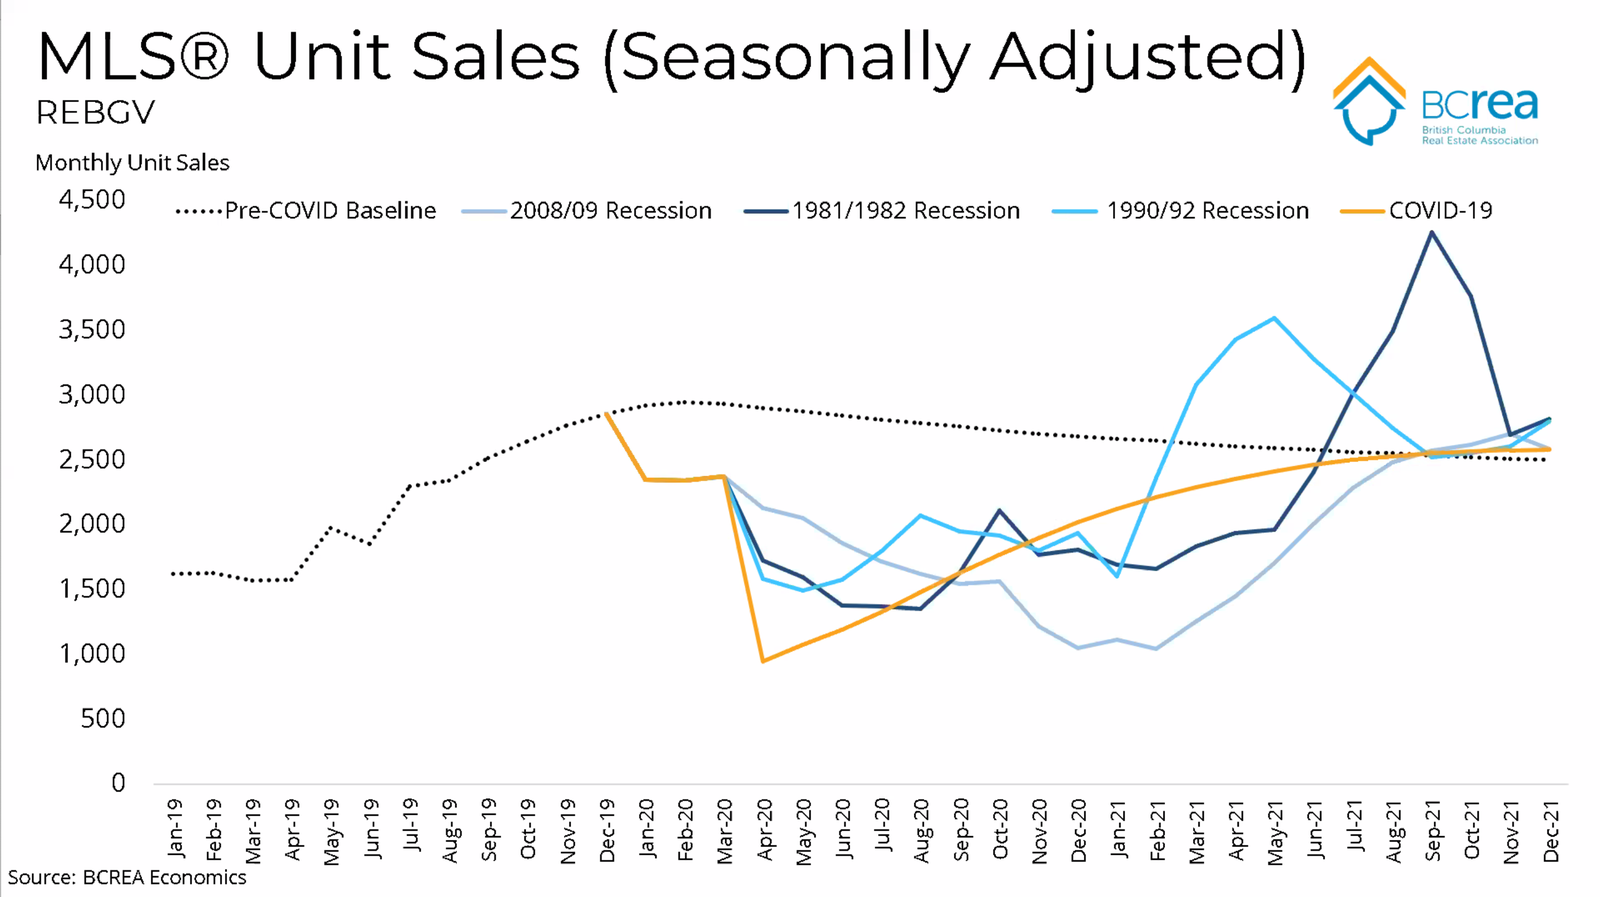
cent, at April 2018 it was up +15.3 per cent., and the YoY MLS® HPI for Bowen at April 2020 was up +17.7 per cent
from April 2017 (the second highest of Metro Vancouver municipalities–Langley City was the highest at +18.4 per
cent).
The MLS® H...
STATS ON BOWEN - March 2020
Posted on Apr 11, 2020
Although new listings fo...
COVID-19 and Bowen Real Estate
Posted on Mar 20, 2020
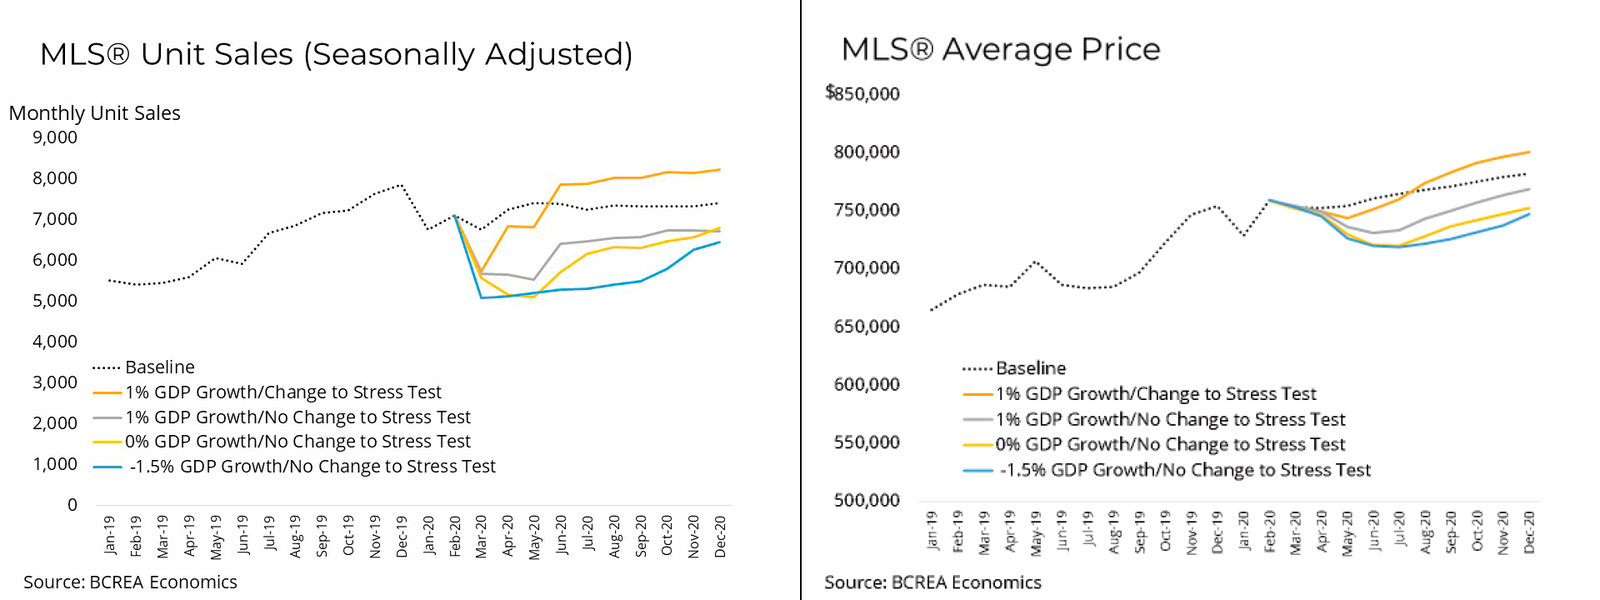
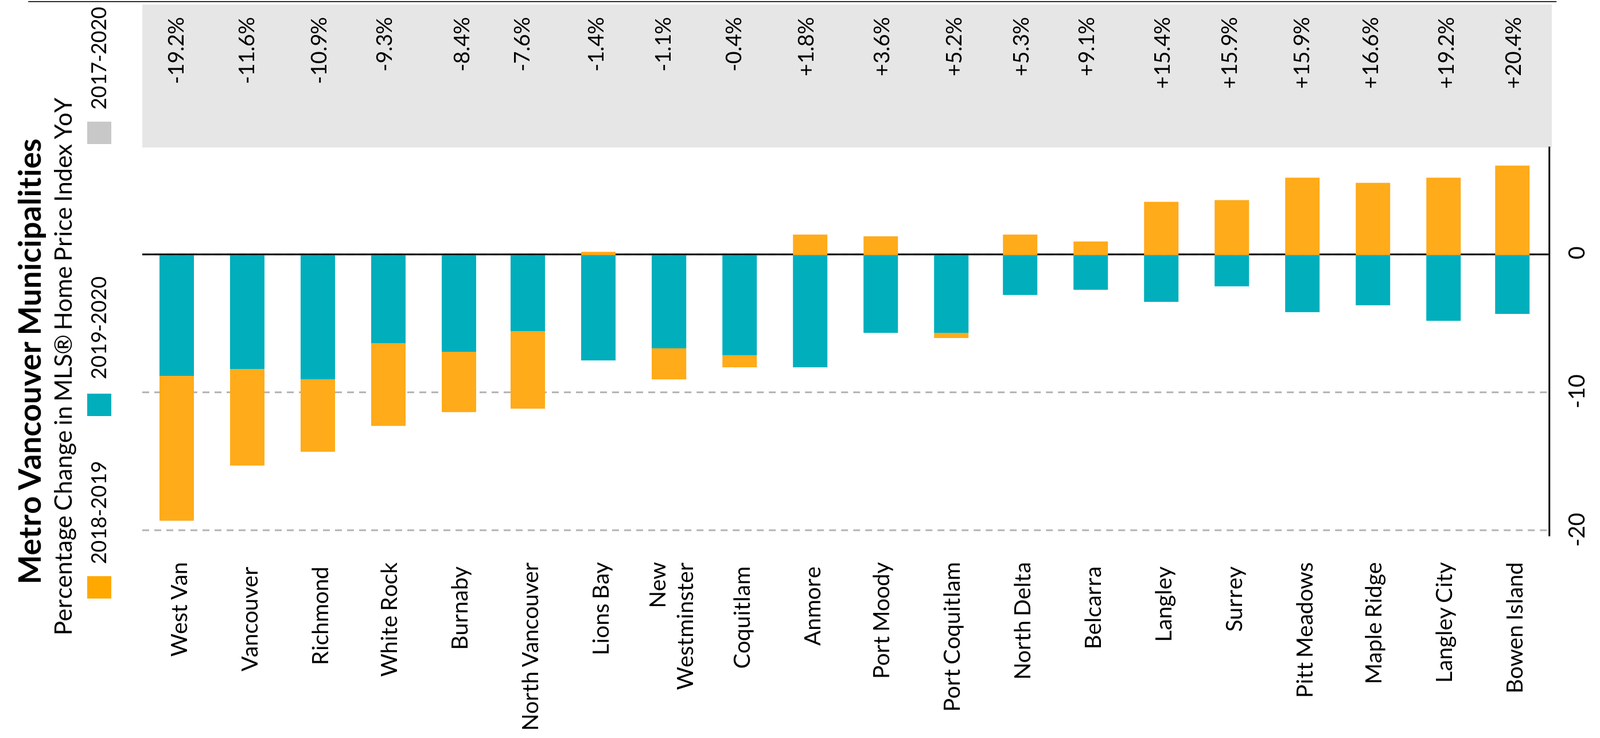
Figure A and B illustrate the BCREA (BC Real Estate Association) scenarios on the potential impact of COVID-19 on the BC housing market.*
“While it’s unknown how the unfolding COVID-19 outbreak will impact the economy in the long-term, BC is facing a sudden stop in economic activity with little guidance to when things may return to normal. Based on...
STATS ON BOWEN - February 2020
Posted on Mar 19, 2020